• WANTED: Happy members who like to discuss audio and other topics related to our interest. Desire to learn and share knowledge of science required. There are many reviews of audio hardware and expert members to help answer your questions. Click here to have your audio equipment measured for free!

Just when you thought you understood vented speaker impedance!

Rick Sykora

Major Contributor
Forum Donor
Joined
Jan 14, 2020
Messages
3,613
Likes
7,347
Location
Stow, Ohio USA
Warning: This is a very narrowly focused thread. Please read all the content and be prepared to offer evidence for any new claims. Thanks! Rick

In my thread about Understanding Vented Speaker Impedance, I had used some definitions for the maxima and minima that came from the BassBox Pro manual. Here is a snippet from the online manual for reference:
index.php

As you can see the following are defined as follows:
  1. The first peak (maxima) is the resonance of the vents
  2. The minima (in the middle) is the system resonance of the box
  3. The second peak is the resonance of the driver in the box
One member challenged the first definition and, although I had considered this pretty staid material, started to research a bit more. Bassbox has been trusted for decades and is based on the work of Richard Small and his very established research done in the early 1970s. Having relied on Bassbox for years and found its modeling to be accurate, did not give these definitions much scrutiny. So, happened to have Small's AES papers and the main reference I found was in his Large Signal Analysis paper. In this paper he defines the first peak as fL, the minima as fM and the second peak as fH. Small also outlines a relationship between them based on fM being equal to fB and cites other research that establishes this holds as long as the voice coil inductance is low. For the Purifi woofer I am using this seems to apply and so then Small also states a mathematical relationship with them being:

fSB = (fL * fH) / fB where fSB is the resonance frequency for the driver for the air-load mass presented by the enclosure.

While this all seems straightforward, was left feeling it really did not help resolve the question over the Bassbox definition for the first peak (fL). Small's work includes some simplified electrical circuits analogs for a vented speaker. For brevity, I am not citing those here. Later, a more detailed model is supplied as you will see.

While have diverse engineering experience, am not an experienced electrical engineer and was unsure of whether I could get an answer from Bassbox creators after all these years, so started to search around the Internet for more detailed design vented speaker analysis and discovered the content was surprisingly inconsistent and weak. As you might expect, most of what I found was focused on the box resonance (fB) as it is the most fundamental parameter. As I had done, many were relying on one or more software packages to help with vented box design. So, I turned to my network for some expertise...

I sought some more contemporary help from the creator of VituixCAD (Kimmo Saunisto) and @Justin Zazzi who is working on his master degree in Acoustics and is on the Directiva r2 team. The initial part of this thread is a summary of the exchange between the member (@witwald) who challenged the Bassbox definition, Kimmo, Justin and I.

Normally would prefer to split this into a few posts, I have found that this can disrupt continuity, so apologize in advance for the long post. @witwald's original question was "Doesn't the impedance minimum between the two low-frequency impedance peaks correspond to the port tuning frequency? " My short response was yes, but later pointed out this seemed to be in conflict with the Bassbox definition for the first peak. I agreed, so made some attempts to define. fL was proposed, but I was looking something more meaningful than frequency Lower. He later found that the fL peak corresponded to back EMF from the woofer. While progress, I wanted to know what caused the back EMF?

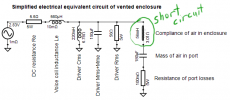
Here is where I consulted Kimmo and he responded with the following model:

1660418488927.png


...(By the way) || is parallel connection, + is series connection

index.php


END OF Kimmo response

Later Kimmo supplied a VituixCAD project file for the model which is attached. I shared this with the group and will share my takeaways in my next post.

Expect that others in the group as well as the broader ASR membership will add to the thread discussion and hopefully drive towards a better understanding of vented speaker design.
 

Attachments

  • Electrical_equivalent_vented.zip
    2.2 KB · Views: 102
Last edited:
OP
Rick Sykora

Rick Sykora

Major Contributor
Forum Donor
Joined
Jan 14, 2020
Messages
3,613
Likes
7,347
Location
Stow, Ohio USA
Looking at Kimmo's model, a few aspects had some immediate appeal to me:
  1. It expanded upon Small's model
  2. It shows how the 3 main resonances relate and how they overlap
  3. It offers a basis for why the Bassbox creators defined fL as they did
  4. Once you get a handle on the components, you can use it to try some things yourself...
So, my first test was to see if the model applied for a simpler sealed speaker. In this case, this represented by the capacitor labeled Cmep. Cmep represents the mass of air in the port. So, if you remove Cmep from the model, you should get something that looks like a sealed speaker impedance. So, I shorted it out and got this...

1660424110346.png

So, as looks more like a sealed speaker measurement, it passes that test.

Putting Cmep back in the model, wanted to verify that the second peak for the model is dependent upon the driver mass. This is represented by Cmes and so removed it from the model and got this...

1660424515442.png

Not as easy to see without actually doing in the software, so for those who do not have VituixCAD installed, here is look using an overlay of this signal over the original...

1660424745811.png

The original impedance is the aqua trace and black is the one with the driver mass removed. So, while a real speaker will have a speaker with some mass, you can see that the second peak is very dependent on the driver mass component. So, the model passes this test nicely too!

Off to a good start. So what about the Bassbox definition for the lower peak? If you trust the model, it does indicate that the first peak (fL) is due to the port and it is a resonance, but so is fB. Given the greater focus on fB and the established dialog, seems rather confusing to define the first peak as the port resonance. So, seems best that we define it some different way. I have some ideas but going to call on @Justin Zazzi (and possibly others) to take it further. I should mention that the Bassbox definition for the second peak has comparable questions, so the overall result should address both parameters.
 
Last edited:
OP
Rick Sykora

Rick Sykora

Major Contributor
Forum Donor
Joined
Jan 14, 2020
Messages
3,613
Likes
7,347
Location
Stow, Ohio USA
Me too!;)

Will be better as soon as we get the parameters defined and then can move on to application. My last university math class was Applied Numerical Methods. It was also the best one as finally got into what useful stuff could be done with advanced math.
 

witwald

Senior Member
Forum Donor
Joined
Jul 23, 2019
Messages
480
Likes
505
Looking at Kimmo's model, a few aspects had some immediate appeal to me:
  1. It expanded upon Small's model
Below is Kimmo's model:
1660463779542.png

Below is Small's (1973) model:
1660463841109.png

The main differences appear to be in the DCR (DC resistance) of each of the inductors in Kimmo's model, and the inclusion of the inductor LE. This inductor is there to represent the voice-coil inductance, but was deliberately neglected in Small's model because it has negligible effect at low frequencies.

In Kimmo's model, the value of DCR for LCES has a considerable effect on the height of the peak at fL. However, its link back to the dynamic system that we are trying to model remains to be clarified. Why the driver compliance term would need an additional series resistor is unclear, as the driver suspension losses (resistance) are included via the RES component.
 
OP
Rick Sykora

Rick Sykora

Major Contributor
Forum Donor
Joined
Jan 14, 2020
Messages
3,613
Likes
7,347
Location
Stow, Ohio USA
Below is Kimmo's model:
View attachment 224113
Below is Small's (1973) model:
View attachment 224114
The main differences appear to be in the DCR (DC resistance) of each of the inductors in Kimmo's model, and the inclusion of the inductor LE. This inductor is there to represent the voice-coil inductance, but was deliberately neglected in Small's model because it has negligible effect at low frequencies.

In Kimmo's model, the value of DCR for LCES has a considerable effect on the height of the peak at fL. However, its link back to the dynamic system that we are trying to model remains to be clarified. Why the driver compliance term would need an additional series resistor is unclear, as the driver suspension losses (resistance) are included via the RES component.

Thanks for the comparison. In any case, should have emphasized that these are “simplified” models. Some of the details are brought out in the auxiliary equations. More to come.
 
Last edited:
OP
Rick Sykora

Rick Sykora

Major Contributor
Forum Donor
Joined
Jan 14, 2020
Messages
3,613
Likes
7,347
Location
Stow, Ohio USA
Below is Kimmo's model:
View attachment 224113
Below is Small's (1973) model:
View attachment 224114
The main differences appear to be in the DCR (DC resistance) of each of the inductors in Kimmo's model, and the inclusion of the inductor LE. This inductor is there to represent the voice-coil inductance but was deliberately neglected in Small's model because it has negligible effect at low frequencies.

In Kimmo's model, the value of DCR for LCES has a considerable effect on the height of the peak at fL. However, its link back to the dynamic system that we are trying to model remains to be clarified. Why the driver compliance term would need an additional series resistor is unclear, as the driver suspension losses (resistance) are included via the RES component.
Probably worth noting for the less technical observer, these 2 models are almost identical.

As @witwald mentions, Kimmo's model includes the driver inductance (Le). Other than that, the only other speaker difference is the term Rel vs Rep. Small describes Rel as enclosure leakage whereas Kimmo describes as port losses. In either case, the value is small enough that does not play a significant role in this discussion. Small's Rg is the output resistance of the amplifier and is negligible here as well.
 

alex-z

Addicted to Fun and Learning
Joined
Feb 19, 2021
Messages
914
Likes
1,694
Location
Canada
As @witwald mentions, Kimmo's model includes the driver inductance (Le). Other than that, the only other speaker difference is the term Rel vs Rep. Small describes Rel as enclosure leakage whereas Kimmo describes as port losses. In either case, the value is small enough that does not play a significant role in this discussion. Small's Rg is the output resistance of the amplifier and is negligible here as well.

That would depend on the scale of the port losses and enclosure losses.

The port geometry itself can influence boundary layer friction, and therefore compression aka port loss at varying SPL.

Drivers with phase plugs introduce an air leak, which is more substantial than a simple cabinet simulation would indicate.

So a more complete model would have a loss factor for the driver itself and a loss factor for absorption material inside the cabinet. Unfortunately, I don't think the port losses cannot be accurately described with a steady state circuit, that is the realm of physics simulation software like COMSOL. The current models used in BassBox Pro and VituixCAD are good for approximation, but impedance sweeps at various SPL is required for perfection.
 
OP
Rick Sykora

Rick Sykora

Major Contributor
Forum Donor
Joined
Jan 14, 2020
Messages
3,613
Likes
7,347
Location
Stow, Ohio USA
That would depend on the scale of the port losses and enclosure losses.

The port geometry itself can influence boundary layer friction, and therefore compression aka port loss at varying SPL.

Drivers with phase plugs introduce an air leak, which is more substantial than a simple cabinet simulation would indicate.

So a more complete model would have a loss factor for the driver itself and a loss factor for absorption material inside the cabinet. Unfortunately, I don't think the port losses cannot be accurately described with a steady state circuit, that is the realm of physics simulation software like COMSOL. The current models used in BassBox Pro and VituixCAD are good for approximation, but impedance sweeps at various SPL is required for perfection.

Thanks for sharing. The losses should still be part of the overall discussion as well as the output level. As I showed in the Understanding Impedance thread, enclosure leakage can have significant effect. However, unless their value changes by orders of magnitude, they are not going to change a vented box into a something else. More likely, they will warp the presentation in some way. Intended to show that in the thread first, but since you brought it up, let's show the readership what happens when Rep is changed from its current 100 mohm value to 10 ohms...

1660485349808.png

The black is the original signal, and the blue is the high leakage case. Unless the design intentionally has some lossy characteristic, the rise in the minima is a telltale sign that a speaker has some loss/leakage.
 
Last edited:

Lambda

Major Contributor
Joined
Mar 22, 2020
Messages
1,792
Likes
1,530
related:


People uses (LT)Spice since ever for speaker simulation.
Now there is a convent user friendly toolkit for this:
 

HansHolland

Active Member
Joined
Feb 12, 2020
Messages
100
Likes
77
Location
near Eindhoven, Nederland
I always thought that the in frequency lowest impedance peak is due to the resonance of the driver plus the port together. The increased mass (compared to the mass of the driver alone) gives a lower resonance frequency.

And it also explains the high excusions that the driver makes below the box resonance (were the impedance is at it lowest between the 2 peaks).

But, as I wrote : "I always thought...".
 
OP
Rick Sykora

Rick Sykora

Major Contributor
Forum Donor
Joined
Jan 14, 2020
Messages
3,613
Likes
7,347
Location
Stow, Ohio USA
I always thought that the in frequency lowest impedance peak is due to the resonance of the driver plus the port together. The increased mass (compared to the mass of the driver alone) gives a lower resonance frequency.

And it also explains the high excusions that the driver makes below the box resonance (were the impedance is at it lowest between the 2 peaks).

But, as I wrote : "I always thought...".
Hold that thought as we are not done here...

This is a complex system with interacting components. The simplified model from Kimmo makes sense to me but still seems to have some missing aspects. Hoping Justin will fill these in soon, but as Kimmo had to write working software, am confident his model is valid. Is it valid for every speaker at every drive level, probably not if all the old AES papers conditions still hold. Small’s model made exceptions for large voice coil inductance and phase considerations.
 

ctrl

Major Contributor
Forum Donor
Joined
Jan 24, 2020
Messages
1,633
Likes
6,240
Location
.de, DE, DEU
This is a complex system with interacting components. The simplified model from Kimmo makes sense to me but still seems to have some missing aspects.
The simplified model shown by Kimmo can be further approximated to reality step by step.

In the book "Lautsprecher - Dichtung & Wahrheit" by Schwamkrug, Römer (page 179ff), which is free, but unfortunately only available in German, it is described how the simplified model can be extended.
Let me try to give a summary.

We start with the model shown by Kimmo:
1660517264820.png

C1 = Driver Mms + Mme
L1 = Driver Cms
R1 = Driver Rms

C2 = Mass of air in port
L2 = Compliance of air in enclosure
R2 = Resistance of port losses

So far, nothing new.
The static frictional resistances of the driver and port are now replaced by frequency-dependent radiation resistances R'1 and R'2. This changes the electrical equivalent circuit only slightly.:
1660517322254.png

R'1 = Driver Rms --> replaced by frequency dependent radiation resistance of the membrane
R'2 = Resistance of port losses --> replaced by frequency dependent radiation resistance of the port
You can look up the formula for the radiation resistance in the book.

What is missing now is the mutual influence of these two radiation resistors depending on position and distance (of driver and port) - a radiation coupling/interaction results.
The radiation coupling ("acoustic coupling"?) represents another air mass and influences the radiation resistances and mass of driver and port:

1660518449125.png

C'1 = Driver Mms + Mme, modified by radiation coupling
C'2 = Mass of air in port, modified by radiation coupling
C'3 = Air mass of the coupling
R'3 = Radiation resistance of the coupling

The new air mass C'3 is shifted in the near field between cone and port when the sound radiation (of cone and port) is out of phase. This removes energy from the oscillating system, which can now no longer contribute to the sound radiation.

An example shows the effects of the extended electrical equivalent circuit. The black shaded area shows the sound pressure difference when the radiation coupling is taken into account:
1660519515113.png

B1 = Excursion driver
B2 = Excursion port or PR
C1 = sound pressure driver
C2 = sound pressure port or PR
A1, A2 = complex sound pressure summation
D = Influence of radiation coupling

To the left of the resonant frequency, there is a sound pressure loss because the two sound radiating surfaces (port and cone) are not in phase, i.e. an air mass is shifted between port and cone and energy is extracted from the oscillating system.
Above the resonance frequency, there is a gain of up to 3dB in sound pressure due to the radiation coupling and in-phase radiation of cone and port.

Unfortunately, there is no impedance diagram in the book showing the radiation coupling effect.
 
Last edited:

Justin Zazzi

Member
Joined
Sep 12, 2020
Messages
32
Likes
32
Location
Tempe, AZ
Below is Kimmo's model:

Below is Small's (1973) model:
View attachment 224114
The main differences appear to be in the DCR (DC resistance) of each of the inductors in Kimmo's model, and the inclusion of the inductor LE. This inductor is there to represent the voice-coil inductance, but was deliberately neglected in Small's model because it has negligible effect at low frequencies.

In Kimmo's model, the value of DCR for LCES has a considerable effect on the height of the peak at fL. However, its link back to the dynamic system that we are trying to model remains to be clarified. Why the driver compliance term would need an additional series resistor is unclear, as the driver suspension losses (resistance) are included via the RES component.

You're right, the resistance in Res would normally contain the losses for the suspension when the circuit is drawn in the mechanical domain. The image below is from Klippel's application note AN_49 on suspension creep losses and you can see the left side is the electrical domain, the right side is the mechanical domain, and they are coupled with a gyrator. The main difference is that one above by Small has the mechanical parts in the electrical domain and so they are in parallel, whereas the circuit below has the mechanical parts in the mechanical domain so they are in series.
(you can notice the electrical domain by the first subscript "e" such as in Re and Le, and you can see the mechanical domain with the first subscript "m" such as in Cms and Rms)

When the lossy block Rms is in series with a lossy block like the compliance Cms below, the losses can be consolidated inside the Rms block because they are in series. In the lossy compliance block Lces in the circuit above that you quoted, the lossy component cannot be moved inside the Res block because they are in parallel but the lossy mechanism needs to be in series.


1660615857047.png


I believe adding the DC resistance to the inductors in Kimmo's model is an attempt to improve the model to include more complex behaviors such as suspension creep. You can see a lot more about it in the app note linked below. Notice the compliance model was improved by having both the Cms term and the R_Cms term which is the addition of a DC resistance in series with the compliance block.


1660616310461.png
 
Last edited:

Justin Zazzi

Member
Joined
Sep 12, 2020
Messages
32
Likes
32
Location
Tempe, AZ
I always thought that the in frequency lowest impedance peak is due to the resonance of the driver plus the port together. The increased mass (compared to the mass of the driver alone) gives a lower resonance frequency.

And it also explains the high excusions that the driver makes below the box resonance (were the impedance is at it lowest between the 2 peaks).

But, as I wrote : "I always thought...".

Nice! I think this is correct, and the extra cone excursion at the lowest frequencies caught my eye too! I started exploring by experimenting with Kimmo's circuit model in VituixCAD.

I made the assumption that when the frequency is "low enough", the air inside the box would no longer act as an air spring and it would only act as an acoustic mass, sloshing into and out of the box through the (relatively) constricting port. To model this, I removed the effect of the compliance of the air in the box by short circuiting the inductor.

1660618023958.png


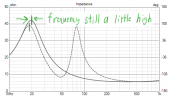
The result was a single impedance peak very similar to the one at f_L, but at a slightly higher frequency. I noticed the model only has an acoustic mass for the air in the port, and there is no circuit element representing the air inside the enclosure. The model could be improved a little bit (similar to how ctrl was improving it before) by adding another element to represent the acoustic mass of the air in the box. Or, for simple exploration, I changed the value of the capacitor that represents the air in the port.

This adjusted the frequency of the first resonance to match the peak at f_L very nicely. The overall height is a bit taller than the complete vented box model. I believe this reasonable because the air in the box is no longer being compressed and so the lossy element from that air compression is no longer present. This allows the first peak to rise just a bit as shown in the graph below.

1660618841235.png


But what exactly is f_H?
I'm not sure, still thinking.
 

Attachments

  • 1660617157939.png
    1660617157939.png
    28.9 KB · Views: 43
  • 1660617976796.png
    1660617976796.png
    42.3 KB · Views: 33

witwald

Senior Member
Forum Donor
Joined
Jul 23, 2019
Messages
480
Likes
505
But what exactly is f_H?
The peak at f_H is simply due to the loudspeaker driver being mounted in the box. At higher frequencies, the capacitor Cmep (mass of air in the port) behaves more more like a short circuit, as its impedance is getting smaller, leaving Lceb (compliance of air in the box), whose impedance is getting larger, to interact with the circuit components that represent the driver. Hence, the model becomes more like that of a driver in a closed box.
 

witwald

Senior Member
Forum Donor
Joined
Jul 23, 2019
Messages
480
Likes
505
Below is Benson's (1996) complete electrical equivalent circuit for the damped vented box system, but simplified by omitting voice-coil inductance (Lvc) in series with Rvc. It's easy enough to add Lvc back in if need be, and more sophisticated and more accurate models of "voice-coil inductance" can be used if desired. For example, in many drivers, the phase shift due to the "voice-coil inductance" only gets to around 45° instead of the expected 90° (for a pure inductor).
1660636574777.png

Source: Benson, J. E. (1996). Theory and Design of Loudspeaker Enclosures. Revised first edition. Howard W. Sams & Company. ISBN: 0-7906-1093-0. OpenLibrary link.
 

Tommythecat

New Member
Joined
Aug 17, 2022
Messages
2
Likes
2
The analysis that there are three, distinct impedance peaks in a vented enclosure is incorrect/incomplete.

The impedance curve for a vented enclosure is a single, and large, system resonance (combination of the enclosure, vent, and driver) which has a minimum at the system tuning frequency. The minimum impedance at system resonance comes from the fact that the velocity (and excursion) has a minimum due to the influence of the very large resonance of the system - the resultant pressure inside the enclosure reduces the cone motion and the vent does all the work.

The reason an impedance peak exists at low frequency (ignore inductance related impedance rise towards higher frequencies) at all is due to the back-emf generated by the motor. Just as the diaphragm velocity is driven by Bl*i(current), the back-emf is a voltage driven by Bl*v(velocity). For instance, in free-air the driver has a single peak at the resonance frequency. This is because the velocity is highest around the resonance frequency and the back-emf generated voltage is what we measure in an impedance curve.

With a vented loudspeaker the velocity curve will have a minimum due to the enclosure air pressure* at the system resonance. This velocity curve is "reflected" into the impedance curve due to the back-emf which creates two peaks at the velocity maximums and a minimum at the system resonance. There are no distinct causes of the maxima/minimum - it is the total combination of parameters (mass, bl, stiffness, vent dimensions, box leakage, etc) which determine the frequencies, heights, widths and every other quality of the impedance variations at low frequency. It is not a complete picture of the situation to ascribe a single "cause" to the impedance maxima - they only exist due to back-emf.


*side note: another common misconception is that a vented loudspeaker has a lower internal pressure than a sealed loudspeaker. This is false at the system resonance of the vented enclosure, the pressure is much higher than a sealed enclosure, but is true below the resonance where the vent "unloads".
 

Justin Zazzi

Member
Joined
Sep 12, 2020
Messages
32
Likes
32
Location
Tempe, AZ
The analysis that there are three, distinct impedance peaks in a vented enclosure is incorrect/incomplete.

The impedance curve for a vented enclosure is a single, and large, system resonance (combination of the enclosure, vent, and driver) which has a minimum at the system tuning frequency. The minimum impedance at system resonance comes from the fact that the velocity (and excursion) has a minimum due to the influence of the very large resonance of the system - the resultant pressure inside the enclosure reduces the cone motion and the vent does all the work.

The reason an impedance peak exists at low frequency (ignore inductance related impedance rise towards higher frequencies) at all is due to the back-emf generated by the motor. Just as the diaphragm velocity is driven by Bl*i(current), the back-emf is a voltage driven by Bl*v(velocity). For instance, in free-air the driver has a single peak at the resonance frequency. This is because the velocity is highest around the resonance frequency and the back-emf generated voltage is what we measure in an impedance curve.

With a vented loudspeaker the velocity curve will have a minimum due to the enclosure air pressure* at the system resonance. This velocity curve is "reflected" into the impedance curve due to the back-emf which creates two peaks at the velocity maximums and a minimum at the system resonance. There are no distinct causes of the maxima/minimum - it is the total combination of parameters (mass, bl, stiffness, vent dimensions, box leakage, etc) which determine the frequencies, heights, widths and every other quality of the impedance variations at low frequency. It is not a complete picture of the situation to ascribe a single "cause" to the impedance maxima - they only exist due to back-emf.


*side note: another common misconception is that a vented loudspeaker has a lower internal pressure than a sealed loudspeaker. This is false at the system resonance of the vented enclosure, the pressure is much higher than a sealed enclosure, but is true below the resonance where the vent "unloads".

I like your analysis Tommy. I kept coming back to what causes what. There are three unique frequencies in the impedance curve where the phase response passes through zero degrees indicating a likely resonance. This happens at the impedance minimum where cone movement is minimum, and again at the two impedance peaks where cone motion is maximum due to the back emf like you clearly outline.

I think where Rick was going with this is ... what factors in the system are dominant at those particular frequencies and therefore responsible for the local maximums in cone velocity? I absolutely agree with you that it's a large continuous system and it is maybe unfair to try and isolate certain components without regard to how they interact with the other components (stiffness, mass, resistance, inductance, enclosure, port, etc).

This exploration feels similar to analyzing the impedance chart of a woofer playing in free air and being able to clearly see that the resonant frequency is easily predicted by a combination of the two dominant mechanisms at that frequency: suspension stiffness and mass. There are certainly other components in the system like inductance, voice coil resistance, magnetics, eddy currents, heat transfer, and so on .... but those other components are insignificant at the mechanical resonant frequency that they can be minimized or simplified in order to better understand what is happening *right there*.

I think this is what Rick is trying to do, to explore what is happening *right there* at the lower and upper impedance peaks.
At least, this is what I'm trying to do haha.


edit: oh and welcome to the forum! this looks like your first post
 

witwald

Senior Member
Forum Donor
Joined
Jul 23, 2019
Messages
480
Likes
505
Should not[e] that Reb is present in Kimmo's model as the resistance of Lceb.
Kimmo's circuit has Reb in series with Lceb. Benson's circuit has it in parallel. They'll have somewhat different effects, won't they? So, they are similar yet distinctly different.
So, only change is addition of Rep. This does have the advantage of separating Rel and Rep. So respectively, now the enclosure and port losses can be manipulated independently.
That is an advantage. It's also noticeable that Rep is in parallel with Cmep, just like Reb is in parallel. No doubt that's by design.
 
Top Bottom