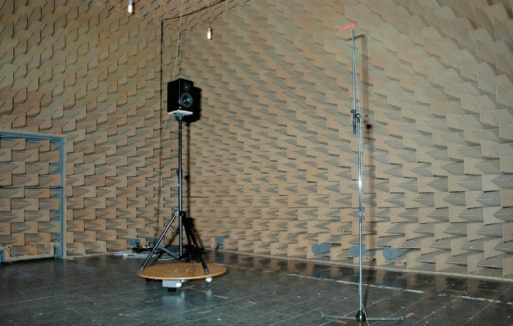
That's correct. That experiment is in play as I measure at 1000 points with KH80. I am hoping this is as high as we need to go. But if not, then the number can be increase again at the high cost of measurement time. Then again it is automated so it is not too bad at the end of the day.
Um, maybe I'm a bit confused then - I thought you would also try to regenerate a spinorama from the original measurement of the first KH80 from your first review, but using the Klippel software (not remeasuring - just reprocessing) to adjust the axis about 5 cm down in the vertical dimension to match the intended reference axis? It seems like both experiments would provide useful insights. I don't think I've seen you post any spinorama that was not generated from the measurement axis (i.e. twitter axis), but maybe I missed it?
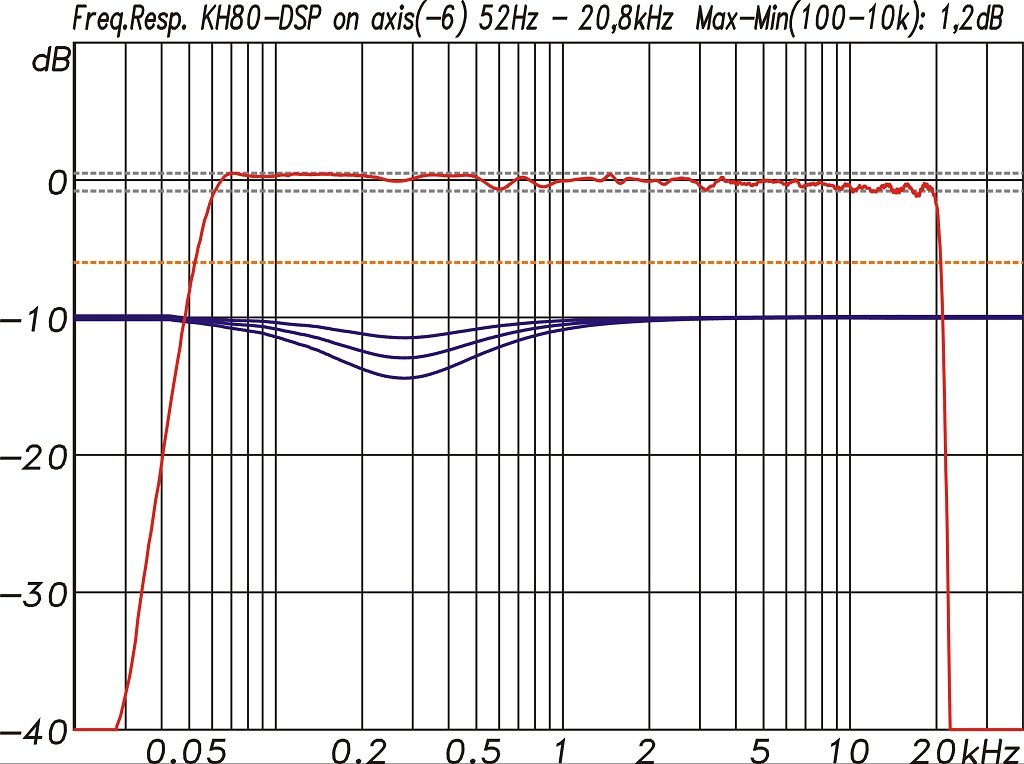
One thing we need to find out about the anechoic measurements of KH80 is what smoothing/frequency resolution they are using. I have not seen that document. The S&R magazine just says what the sample rate of audio was from the microphone, not the resulting resolution of their graph. Has anyone seen otherwise?
Is this about the bass dip issue? Given that the bass deviation is quite low Q, I would expect it to show up in any measurement, even one that uses some moderate amount of smoothing. If we're talking about treble tilt, that's low Q too, so smoothing shouldn't matter there either. High-Q deviations are a different story of course.
Far field is defined by simple 6 dB SPL reduction when doubling the distance.
You did not directly answer my question, but it looks like you're saying that the spinorama plots are, in fact, simulating far field conditions? I.e. they're not simulating a fixed 2-meter distance or anything like that?
It has no way of knowing microphone characteristics. It however checks its own work with respect to field expansion as I have shown.
Okay. Maybe the directivity characteristics of the microphone could explain why, in the graphs you posted in
post #188, the fitting error suddenly increases at high frequencies. More on this below…
In an anechoic chamber, you have a similar problem as the speaker is rotated and angle of incident changes relative to microphone.
Sure, but that's not really the same situation. Presumably, in the anechoic chamber setup, for the
on axis (0°) measurement, the speaker is directly facing the microphone - it only becomes an issue for off-axis measurements (which are less critical). This means that, for the critical on-axis measurement, the angle of incidence is zero - which is ideal as the directivity of the microphone doesn't matter in this case. The result should therefore be accurate for the on-axis measurement, at least.
For the NFS it's different, because if the NFS decides to measure a point really, really close to the speaker - and my understanding is that it sometimes does - the angle of incidence from the tweeter could become quite large (say, 30°? maybe even 60°?), leading to the NFS underestimating high frequencies. I'm wondering if this is exactly the reason why Klippel recommends using the tweeter as the measurement "focus point" - it's to minimize the angle of incidence on the microphone. That would make perfect sense to me, and unless I missed something it would completely explain the results you've been getting so far.
In any case, I agree that this problem should indeed be detected as "fitting error", because the NFS would get different results when measuring points at various angles of incidence from the tweeter that it cannot reconcile. The problem is, it's quite possible the NFS simply
can't fix that fitting error simply by measuring more points, because if it does that, it will just keep getting seemingly inconsistent results from various angles of incidence, and that will "confuse" the NFS even more (in other words: measuring more points will fail to bring the error down, or only very slowly). Maybe the point of specifying the "tweeter axis" is precisely so that the NFS can detect this situation and "prioritize" the measurements that were taken directly in front of the tweeter as more accurate in high frequencies? Does that make sense?
As I keep saying, we need to be focused on the high level picture. Slight differences are simply not material with respect to predicting listening response in their own room.
Well, you showed in your first post that getting the axis wrong can result in -5 dB deviation at 10 kHz in the resulting spinorama plots. That's not "slight" at all, to me. It would be great if we could clearly understand what's going on deep down in these experiments so that we know what to expect in the future.


")