
A few weeks ago I reviewed the Neumann KH80 DSP powered monitor. The measurements while very good, did not match manufacturers published graph which showed dead flat on-axis response. Third-party measurements had shown the same so objection was raised that my measurements must be in error. I had to send that sample back to its owner but as it happens, another member had offered his at the same time. Having another sample allows us to both test sample to sample variations and test the hypothesis put forward for difference in measurements.
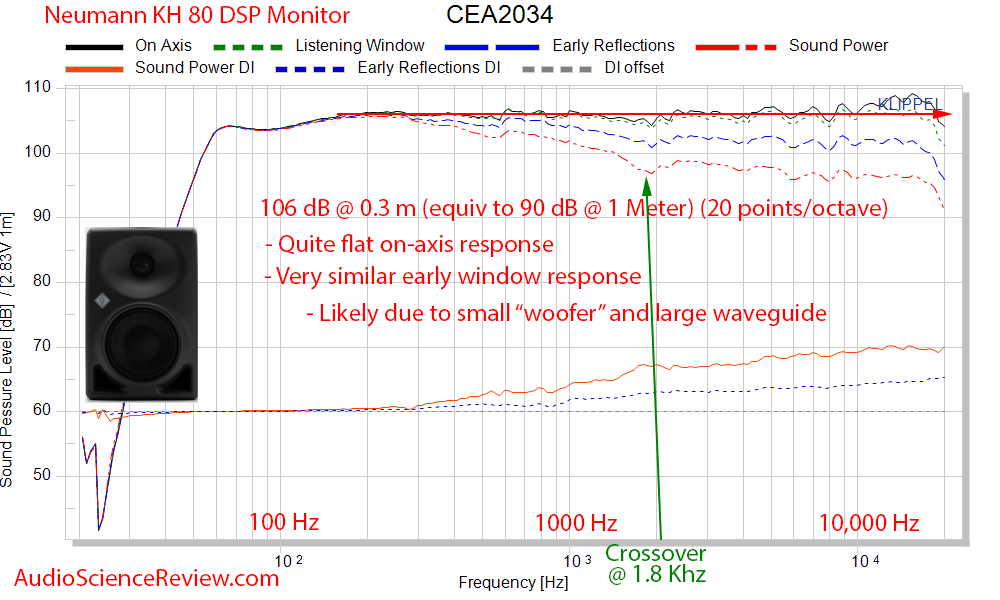
First, let's review what we had in the review:
And here is the manufacturer "interpolated" response:

The small graph compresses differences due to lack of (display) resolution. That aside, we have two differences to investigate:
1. There is no low bass dip a I show.
2. Their response is flatter than what I measured.
Dealing with the second factor first, observation was made that the manufacturer states that the "acoustic center" of the speaker is not the usual tweeter axis but half-way between tweeter and woofer:

The hypothesis around bass dip was that I had pushed the speaker too hard in level and therefore it must have limited the low frequency response. This, despite the fact that there was no visible indication from the speaker that it was doing so.
New Measurements
To address both of these factors, I set the levels much lower then before and for the first pass of measurements, I set the reference to half-way between the two drivers which landed it around the edge of the woofer as they show.
Before I show you that, let me show the in-room response:

This graph shows the proper measured SPL which is around 85 dB. For some reason when the CEA graphs are calculated for powered monitors, the levels are incorrect. I know what is causing it but don't know why. I will be contacting Klippel on that. For now, accept that the levels were very reasonable and not loud at all. Indeed, the levels were so low that some noise got into the measurements around 20 to 30 Hz which is not material.
Note that the above has a vertical dimension of almost 120 dB so that flattens the response.
For completeness, there is the distortion data as a percentage:

Now let's look at the spin data:

Clearly this is not the acoustic center as one would define has having the flattest response. The droop in high frequencies clearly indicates we are not on-axis. We can confirm that by looking at the vertical dispersion:

The highlighted red graph is showing the "on-axis" as measured. The graphs above it are at -10 and -20 degree so they are more "correct." Translating, following the Neumann recommendation has clearly messed up the measurements.
As to bass dip, we still have that. Note that the new graphs are the more proper 50 dB vertical response which the original review did not follow. So there is more roughness still in there than the review data. This is the CEA-2034 recommendation so what we see, is what is required.
As a sanity check, I select the highest measured frequency of 20 kHz and plot that. Usually this is a clean output with just the tweeter "beaming" (narrowing dispersion). That is NOT what I see in this setup:

There are tons of sound sources mixing up to generate this complex soundfield. I can't explain it all. Maybe there are multiple edge differections we are seeing from around the tweeter and woofer rings.
Re-measurements Using Tweeter Axis
Wondering that there may be sample to sample variations, I remeasured the same unit without changing anything but the reference axis to be at the center of the tweeter (as reasonably as I could eyeball it).
Here is our spin data now:

This is more reasonable and nearly mirrors the measurement shown in the original review.
Here are the two new measurements side by side:

It is pretty clear that if Neumann says the speaker has flat response, its acoustic center can't at the same time be where they say it is. One or the other is wrong. I may have an explanation for this though. See later.
Here is our 20 kHz balloon soundfield again:

This is much more correct. We have a single cone now. I am not clear why it is pointing down. Maybe the speaker base is not level? Or drivers are not 100% perpendicular to it? Regardless, the overall picture looks correct so I tend to trust this new measurement with reference axis being the tweeter than below it.
Discussion
Addressing the low frequency measurements, I think most measurements outside of what I am using with Klippel NFS, have some kind of correction for bass region. They do this either because the anechoic room is not anechoic that low, or they are splicing two measurements together. Here is Sound and Recording note on how they measured low frequency response:

Neumann have zero detail so likely have similar restriction. A calibration curve is applied that may be causing it to push up the response a bit versus reality.
Klippel NFS' claim to fame is the ability to be even more accurate than anechoic chambers so if I were to split the tie, I would split it in favor of our measurements being correct. Then again it is possible that my measurement mic has a slight error there. Either way, it is best to not scrutinize these graphs at such close levels.
As to the rest of the response, unfortunately S&R's graph is also of poor resolution:

Lots of sins can be buried in low resolution graphs like that.
On the other side of the coin, there is a potential source of variation in Klippel NFS due to reflections from the fixture at higher frequencies.
With respect to acoustic center, I think this is one of those instances where near-field measurement may cause some issues. Specifically, the Klippel system measures the speaker at 1 foot/0.3 meter or so. This heavily accentuates angular differentials. In anechoic chambers attempt is made to measure in the far field by using 2 meter measurement distance or so. This lowers the accuracy of the acoustic center since small differences in location of the microphone there, doesn't make as much angular difference.
Summary
The new data shows that the original measurement data was correct. The bass dip is not level sensitive. And changing the reference point makes the KH80 speaker look a lot worse, not better.
Ultimately I think both anechoic and NFS measurements have their own slight slants. The two measurements may never 100% sync. The "good news" is that there is hardly any anechoic data out there for speakers whereas I hope to build a large database of measurements using NFS system. So as long as we are consistent, our relative scores should hold.
Above all, let's focus on overall picture of these measurements and not 1 or 2 dB here and there.
------------
As always, questions, comments, recommendations, etc. are welcome.
The pink panthers sat this review out because of all the arguing over the last one. One of them may actually need therapy sessions as a result of that ordeal. Please donate a bit of money so I don't have to pay for that out of my own pocket using: https://www.audiosciencereview.com/forum/index.php?threads/how-to-support-audio-science-review.8150/
First, let's review what we had in the review:
And here is the manufacturer "interpolated" response:
The small graph compresses differences due to lack of (display) resolution. That aside, we have two differences to investigate:
1. There is no low bass dip a I show.
2. Their response is flatter than what I measured.
Dealing with the second factor first, observation was made that the manufacturer states that the "acoustic center" of the speaker is not the usual tweeter axis but half-way between tweeter and woofer:
The hypothesis around bass dip was that I had pushed the speaker too hard in level and therefore it must have limited the low frequency response. This, despite the fact that there was no visible indication from the speaker that it was doing so.
New Measurements
To address both of these factors, I set the levels much lower then before and for the first pass of measurements, I set the reference to half-way between the two drivers which landed it around the edge of the woofer as they show.
Before I show you that, let me show the in-room response:
This graph shows the proper measured SPL which is around 85 dB. For some reason when the CEA graphs are calculated for powered monitors, the levels are incorrect. I know what is causing it but don't know why. I will be contacting Klippel on that. For now, accept that the levels were very reasonable and not loud at all. Indeed, the levels were so low that some noise got into the measurements around 20 to 30 Hz which is not material.
Note that the above has a vertical dimension of almost 120 dB so that flattens the response.
For completeness, there is the distortion data as a percentage:
Now let's look at the spin data:
Clearly this is not the acoustic center as one would define has having the flattest response. The droop in high frequencies clearly indicates we are not on-axis. We can confirm that by looking at the vertical dispersion:
The highlighted red graph is showing the "on-axis" as measured. The graphs above it are at -10 and -20 degree so they are more "correct." Translating, following the Neumann recommendation has clearly messed up the measurements.
As to bass dip, we still have that. Note that the new graphs are the more proper 50 dB vertical response which the original review did not follow. So there is more roughness still in there than the review data. This is the CEA-2034 recommendation so what we see, is what is required.
As a sanity check, I select the highest measured frequency of 20 kHz and plot that. Usually this is a clean output with just the tweeter "beaming" (narrowing dispersion). That is NOT what I see in this setup:
There are tons of sound sources mixing up to generate this complex soundfield. I can't explain it all. Maybe there are multiple edge differections we are seeing from around the tweeter and woofer rings.
Re-measurements Using Tweeter Axis
Wondering that there may be sample to sample variations, I remeasured the same unit without changing anything but the reference axis to be at the center of the tweeter (as reasonably as I could eyeball it).
Here is our spin data now:
This is more reasonable and nearly mirrors the measurement shown in the original review.
Here are the two new measurements side by side:
It is pretty clear that if Neumann says the speaker has flat response, its acoustic center can't at the same time be where they say it is. One or the other is wrong. I may have an explanation for this though. See later.
Here is our 20 kHz balloon soundfield again:
This is much more correct. We have a single cone now. I am not clear why it is pointing down. Maybe the speaker base is not level? Or drivers are not 100% perpendicular to it? Regardless, the overall picture looks correct so I tend to trust this new measurement with reference axis being the tweeter than below it.
Discussion
Addressing the low frequency measurements, I think most measurements outside of what I am using with Klippel NFS, have some kind of correction for bass region. They do this either because the anechoic room is not anechoic that low, or they are splicing two measurements together. Here is Sound and Recording note on how they measured low frequency response:
Neumann have zero detail so likely have similar restriction. A calibration curve is applied that may be causing it to push up the response a bit versus reality.
Klippel NFS' claim to fame is the ability to be even more accurate than anechoic chambers so if I were to split the tie, I would split it in favor of our measurements being correct. Then again it is possible that my measurement mic has a slight error there. Either way, it is best to not scrutinize these graphs at such close levels.
As to the rest of the response, unfortunately S&R's graph is also of poor resolution:
Lots of sins can be buried in low resolution graphs like that.
On the other side of the coin, there is a potential source of variation in Klippel NFS due to reflections from the fixture at higher frequencies.
With respect to acoustic center, I think this is one of those instances where near-field measurement may cause some issues. Specifically, the Klippel system measures the speaker at 1 foot/0.3 meter or so. This heavily accentuates angular differentials. In anechoic chambers attempt is made to measure in the far field by using 2 meter measurement distance or so. This lowers the accuracy of the acoustic center since small differences in location of the microphone there, doesn't make as much angular difference.
Summary
The new data shows that the original measurement data was correct. The bass dip is not level sensitive. And changing the reference point makes the KH80 speaker look a lot worse, not better.
Ultimately I think both anechoic and NFS measurements have their own slight slants. The two measurements may never 100% sync. The "good news" is that there is hardly any anechoic data out there for speakers whereas I hope to build a large database of measurements using NFS system. So as long as we are consistent, our relative scores should hold.
Above all, let's focus on overall picture of these measurements and not 1 or 2 dB here and there.
------------
As always, questions, comments, recommendations, etc. are welcome.
The pink panthers sat this review out because of all the arguing over the last one. One of them may actually need therapy sessions as a result of that ordeal. Please donate a bit of money so I don't have to pay for that out of my own pocket using: https://www.audiosciencereview.com/forum/index.php?threads/how-to-support-audio-science-review.8150/
")