• WANTED: Happy members who like to discuss audio and other topics related to our interest. Desire to learn and share knowledge of science required. There are many reviews of audio hardware and expert members to help answer your questions. Click here to have your audio equipment measured for free!

Measuring 2-channel Buckeye Purifi Amplifier Performance

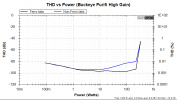
So, as am updating my amps, here is some visual proof for the cause of the slight distortion rise that was seen when Amir tested the Buckey 3 channel amp...
1677353169914.png


Note that the above graph is just THD vs Power. I thought this would be more interesting as the ferrous content primarily introduces distortion. For a preview of updated SINAD vs Power results, see below...
1677350536106.png

Note the expected hockey stick graph as the distortion rise has been reduced. :)
 

Attachments

  • 1677350186204.png
    1677350186204.png
    23.8 KB · Views: 492
Last edited:
So, as am updating my amps, here is some visual proof for the cause of the slight distortion rise that was seen when Amir tested the Buckey 3 channel amp...

View attachment 267430

Note that the above graph is just THD vs Power. I thought this would be more interesting as the ferrous content primarily introduces distortion. For a preview of updated SINAD vs Power results, see below...
View attachment 267431
Note the expected hockey stick graph as the distortion rise has been reduced. :)
It might sound naive, but what are ferro and non-ferro tabs?
 
It might sound naive, but what are ferro and non-ferro tabs?

In this case, the original binding post tabs had steel content, the new ones are brass.
 
Last edited:
Are the graph labels reversed? Shouldn't the non-ferro tabs give lower THD?

index.php

Thanks good point, the label UI is tricky here, will fix. :facepalm:
 
Last edited:
Back
Top Bottom