
-
WANTED: Happy members who like to discuss audio and other topics related to our interest. Desire to learn and share knowledge of science required. There are many reviews of audio hardware and expert members to help answer your questions. Click here to have your audio equipment measured for free!
You are using an out of date browser. It may not display this or other websites correctly.
You should upgrade or use an alternative browser.
You should upgrade or use an alternative browser.
Master Preference Ratings for Loudspeakers
- Thread starter MZKM
- Start date
Yes, he discusses this in his book in chapter 4.6.2.I believe it was Dr. Toole who said that high-Q peaks and dips aren't terribly noticeable but low Q peaks and dips are.
Open the charts for both, highlight the on-axis for the on-axis in the spin data (double click on the on-axis label in legend), the Control 1 has a dip at 8kHZ and a boost >10kHz, but it's mostly flat, the 305 is more consistent, but it has a rise in response, 10kHz is like 4dB louder than 600Hz, so even though it doesn't have as much of dips/peaks, it's not a neutral response.
That wouldn't affect NBD much though, and NBD accounts for most of the score. NBD looks at deviations within 1/2 octave bands, not at the overall trend of the response. In particular NBD definitely won't catch something like "10 kHz is 4 dB louder than 600 Hz", a difference spread over ~4 octaves.
I'm struggling to understand why NBD is so important in the score. 1/2 octave is a tiny part of the spectrum. Olive's patent and study states: "NBD measures deviations within a relatively narrow ½-octave band. NBD might be a better metric for detecting medium and low Q resonances in the loudspeaker." There's a problem of scale here: to me it doesn't make sense to describe as "low Q" a local deviation in a ½ octave band, which by Olive's own admission is "narrow". In fact, when I came across the formula for NBD I immediately assumed that it was designed to catch high-Q resonances. I was shocked to read from Olive's description that it is meant to do the exact opposite!
Because NBD is looking at 1/2 octave bands, it will tend to reward speakers that have flat-ish 1/2 octave "sections", even if these sections are uneven between each other (i.e. low-Q variations). By contrast, if a speaker is generally flat throughout the entire spectrum but each 1/2 section has a lot of high-Q "noise", it will be penalized. Maybe that's the point, but I'm having a hard time reconciling that with @Floyd Toole's study of resonances, which would predict the exact opposite, i.e. that broadband variations matter most, local ones matter less. The only way I could possibly explain this apparent contradiction is listener adaptation, but surely listeners don't have time to adapt in a study setup like Olive's?
(By the way: if I interpret the paper correctly, I get the impression that the 1/2 octave bands used in the NBD calculations are fixed, not sliding. Which means the score can be affected by where the 1/2 octave band boundaries land? Surely that can't be right?)
I would surely like to take a closer look at the individual components in these calculations. @MZKM: mind sharing the source spreadsheet for some of these speakers? Control 1, 305P and RB42 especially, since they have scores that are surprisingly similar given their measurements.
OP
- Thread Starter
- #124
I’ll link them when I get to my computer.That wouldn't affect NBD much though, and NBD accounts for most of the score. NBD looks at deviations within 1/2 octave bands, not at the overall trend of the response. In particular NBD definitely won't catch something like "10 kHz is 4 dB louder than 600 Hz", a difference spread over ~4 octaves.
I'm struggling to understand why NBD is so important in the score. 1/2 octave is a tiny part of the spectrum. Olive's patent and study states: "NBD measures deviations within a relatively narrow ½-octave band. NBD might be a better metric for detecting medium and low Q resonances in the loudspeaker." There's a problem of scale here: to me it doesn't make sense to describe as "low Q" a local deviation in a ½ octave band, which by Olive's own admission is "narrow". In fact, when I came across the formula for NBD I immediately assumed that it was designed to catch high-Q resonances. I was shocked to read from Olive's description that it is meant to do the exact opposite!
Because NBD is looking at 1/2 octave bands, it will tend to reward speakers that have flat-ish 1/2 octave "sections", even if these sections are uneven between each other (i.e. low-Q variations). By contrast, if a speaker is generally flat throughout the entire spectrum but each 1/2 section has a lot of high-Q "noise", it will be penalized. Maybe that's the point, but I'm having a hard time reconciling that with @Floyd Toole's study of resonances, which would predict the exact opposite, i.e. that broadband variations matter most, local ones matter less. The only way I could possibly explain this apparent contradiction is listener adaptation, but surely listeners don't have time to adapt in a study setup like Olive's?
(By the way: if I interpret the paper correctly, I get the impression that the 1/2 octave bands used in the NBD calculations are fixed, not sliding. Which means the score can be affected by where the 1/2 octave band boundaries land? Surely that can't be right?)
I would surely like to take a closer look at the individual components in these calculations. @MZKM: mind sharing the source spreadsheet for some of these speakers? Control 1, 305P and RB42 especially, since they have scores that are surprisingly similar given their measurements.
NBD would care about slope, so an on-axis that is slightly rising will have a worse score.
As for low-Q, depends by your definition of low vs medium A. If there is a valley/dip in a band, the average SPL would be in the middle of the max and min score, thus the difference between the actual and the average would be poor compared to a neutral response.
OP
- Thread Starter
- #126
That’s because the ideal target slope of the PIR according to Olive’s paper is -1.75, but using that, even with a perfectly smooth slope, the NBD_PIR variable is not the ‘ideal’ value of 0 in this case, as it considers the slope itself as a ‘deviation’.
@amirm
Regarding NBD_PIR not accounting for the ideal slope and treating it as a deviation (thus flat PIR being treated as being better), I may have got it:
Neumann adjusted:
Selah adjusted:
Simply created dummy data with a -1.75 slope (target), calculated distance from a 0 slope, and applied difference to original slope.
Score change:
- Neumann: 5.340 to 5.376
- Selah: 4.276 to 4.195
Let me know if you think this is good and that I should apply this change to all speakers.
@Sean Olive
Last edited:
@amirm
Regarding NBD_PIR not accounting for the ideal slope and treating it as a deviation (thus flat PIR being treated as being better), I may have got it:
Neumann adjusted:
View attachment 49019
Selah adjusted:
View attachment 49020
Simply created dummy data with a -1.75 slope (target), calculated distance from a 0 slope, and applied difference to original slope.
Score change:
- Neumann: 5.340 to 5.376
- Selah: 4.276 to 4.195
Let me know if you think this is good and that I should apply this change to all speakers.
Although this is great, as I've said before in response to other proposed changes to the preference formula, we have to match Sean Olive’s formula as close as possible, as the coefficients of variables in the formula were optimised in order to maximise the correlation of the variables as defined by Olive to actual preference scores – we have no idea how changing the formula would change the correlation. So we are stuck using Olive's formula as he described it, even if we think parts of it may not be entirely correct.
Having said that, did you try using the initial formula for Test One on all the other speakers (I know you already applied it to the Neumann)? I do think this would be an interesting experiment that may reveal some useful indications about the current scores.
OP
- Thread Starter
- #129
This is why it’d be great if Sean checked his email(s) from Amir.Although this is great, as I've said before in response to other proposed changes to the preference formula, we have to match Sean Olive’s formula as close as possible, as the coefficients of variables in the formula were optimised in order to maximise the correlation of the variables as defined by Olive to actual preference scores – we have no idea how changing the formula would change the correlation. So we are stuck using Olive's formula as he described it, even if we think parts of it may not be entirely correct.
Having said that, did you try using the initial formula for Test One on all the other speakers (I know you already applied it to the Neumann)? I do think this would be an interesting experiment that may reveal some useful indications about the current scores.
Second, the problem with the listening window is that's it's an average. You can't actually get that response no matter what angle you listen at, because it doesn't correspond to any particular angle. For this reason the score might not match what a typical listener would rate the speaker, even while listening slightly off-axis - it is likely an overestimate from excessive smoothing. One could imagine pathological cases where a speaker has a huge frequency response abnormality at some angles, and the opposite abnormality at other angles, which would average out to "perfect".
This is a very important point, and is why I don't think it's very useful to use the listening window to estimate preference. This possible overestimation of preference is evidenced by the fact that pretty much all the speakers tested so far have their score boosted when using the listening window instead of the on-axis response (just switch back and forth between the 'Price : Performance w/ sub' and 'Price : Performance LW w/ sub' tabs here). I think there was a reason LW didn't make it onto either of the two 'winning' formulas after the multiple regression analysis applied to all possible configurations of independent variables of the model, and I suspect the reason is that using it overestimates the preference rating.
OP
- Thread Starter
- #131
This is true, but it is the only way I can think of to accommodate speakers that sacrifice on-axis for a better listening window or are designed to not be toed-in. Also, any head movement or body shift will knock you out of the on-axis, it won’t be in the +/-10° range, but it will be out, if Amir measures in 5° increments than using +/-5° would have been more accurate.This is a very important point, and is why I don't think it's very useful to use the listening window to estimate preference. This possible overestimation of preference is evidenced by the fact that pretty much all the speakers tested so far have their score boosted when using the listening window instead of the on-axis response (just switch back and forth between the 'Price : Performance w/ sub' and 'Price : Performance LW w/ sub' tabs here). I think there was a reason LW didn't make it onto either of the two 'winning' formulas after the multiple regression analysis applied to all possible configurations of independent variables of the model, and I suspect the reason is that using it overestimates the preference rating.
Geddes claims virtually no speaker with a flat on-axis will have a flat directivity.
Last edited:
The software auto-generates that data based on CEA-2034 recommendation. The raw data is accurate to 1 degree. I can export that too but it is in another format (VACS).Also, any head movement or body shift will knock you out of the on-axis, it won’t be in the +/-10° range, but it will be out, if Amir measures in 5° increments than using +/-5° would have been more accurate.
OP
- Thread Starter
- #133
It would be cool to analyze that for a speaker (or designer) that specifically states no toe-in (like Geddees in the video I linked). For accounting for head movement, a 1ft diameter of head sway at 10ft distance is an angle of >3°, so a +/-2° averaged window may be a more realistic response curve to use rather than directly at 0°. This is me just guesstimating and thinking of ideas though.The software auto-generates that data based on CEA-2034 recommendation. The raw data is accurate to 1 degree. I can export that too but it is in another format (VACS).
The Kali for instance has that dip ~10kHz on-axis, which @Charles Sprinkle confirmed is intended, yet at ~20° we see it’s effect is basically gone, and the predicted in-room response shows only a small influence of it. It is unclear if the on-axis is the intended listening axis though, and the manual makes no statement about toe-in.
miero
Active Member
- Joined
- Aug 1, 2018
- Messages
- 241
- Likes
- 292
There is a free VacsViewer application available:The software auto-generates that data based on CEA-2034 recommendation. The raw data is accurate to 1 degree. I can export that too but it is in another format (VACS).
- http://www.randteam.de/VACS/Index.html
This is a very important point, and is why I don't think it's very useful to use the listening window to estimate preference. This possible overestimation of preference is evidenced by the fact that pretty much all the speakers tested so far have their score boosted when using the listening window instead of the on-axis response (just switch back and forth between the 'Price : Performance w/ sub' and 'Price : Performance LW w/ sub' tabs here). I think there was a reason LW didn't make it onto either of the two 'winning' formulas after the multiple regression analysis applied to all possible configurations of independent variables of the model, and I suspect the reason is that using it overestimates the preference rating.
I completely agree with and recognize these issues, but this is why I advocates for showing both scores. If the score changes substantially using the listening window, then it is a good indicator the speaker should be listened to off-axis. This is It's probably the easiest way of keeping the score inclusive of speakers that weren't designed to be listened to on-axis (which I am willing to bet is a significant portion of home speakers, of not the majority). I think most of the speakers I measure measure better around 10-20 degrees off axis. Off axis is also collectively more common than on axis according to Devantier.
While I've many manufacturers specify a vertical axis, and a few suggest toe in is optional and/or preferential, I've never seen one provide a specific horizontal angle degree to use off-axis; most that say anything usually say to just angle it to whatever sounds best. This makes sense because the best toe in very likely depends on the distance to your sidewalls and your room's furnishings.
So using the listening window isn't perfect, but it's a good compromise. In the case of the Kali, for example, it immediately says " don't listen on axis." In a few cases a speakers flaw's may average out in the listening window, but this is rare and possibly indicative of real world performance. I don't mind that almost every speaker is elevated by the LW, this is expected simply because it's an average. It's how much they change that I'm interested in.
tuga
Major Contributor
So using the listening window isn't perfect, but it's a good compromise. In the case of the Kali, for example, it immediately says " don't listen on axis." In a few cases a speakers flaw's may average out in the listening window, but this is rare and possibly indicative of real world performance. I don't mind that almost every speaker is elevated by the LW, this is expected simply because it's an average. It's how much they change that I'm interested in.
Some speakers like those made by Dali are flat off-axis (the example below looks flat at 45°) and designed to be set up with no toe-in:
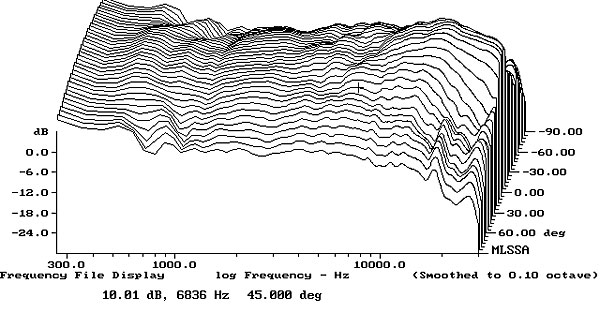
In most domestic situations such speakers will only work reasonably well in large or at least very wide rooms on long-wall setup. Otherwise the amplitude of the sound bouncing off the side walls will be tremendous and they will sound bright.
I think that they should rate poorly.
OP
- Thread Starter
- #138
I actually did to many already, as well as sensitivity and +/-3dB (spec vs measured), I just went to sleep for finishing all of them.
Thanks for the idea @pierre
") .
.Not in the tables though, but in the individual measurements when you click of each speaker‘s name.
One difference is the -dB points are using the same method as LFX (using listening window and sound power curves, not on-axis).
I also added a standard deviation one, which would give a better score to those that are usually consistent but have an area or two of large deviation.
Example using the LS50:
Ignore the green text, but I am thinking of seeing if I can have the text change color if it meets spec of not (green for good, yellow for almost, red for not close).
Last edited:
I'll admit I feel the same way - I'm puzzled as to why the formula concludes the Control 1 is pretty much as good as the 305P (with LFX ignored of course), while anyone eyeballing the graphs would most likely disagree. The breakdown view makes it look like they're mostly equivalent in every aspect (SM_PIR, NBD_ON, NBD_PIR), which is even more eyebrow-raising.
One problem here is the breakdown view is visually misleading, as all four variables have the same scaling in this view, yet they have different weightings in the actual formula. So a small percentage difference in LFX for example has a comparatively large effect on the final score, whereas the same percentage difference in SM_PIR doesn't have as much of an effect. The radar plots don't currently account for this.
@MZKM would it be possible to instead of using a circular radar plot, have an asymmetrical quadrilateral plot, with the distance from the centre to each variable's 'maximum' vertex proportional to that variable's weighting in the formula? If that's not possible, the next best thing would be to use the current plot layout but simply adjust the variable values according to their formula weighting. Although this second option would not visually depict the maximum weighted quadrilateral, it would allow for visually better comparisons between variable values of different speakers, that are more representative of each variable's relative influence on total preference.
Also, the 'Best' value for NBD_PIR is not 0 as you use to calculate the percentage NBD_PIR score for the radar plot, it's more like 0.15 as I showed here using ideal dummy data with a perfectly plat PIR with a slope matching the ideal target of -1.75. (Note this 0.15 value is not exact, as I just used trial and error - the slope I got was actually -1.746. Maybe you can calculate an exact value for NBD_PIR (Best), working backwards from an exact sope of -1.75.)
Last edited:
@MZKM first, thank you for putting these sheets together. I was looking at Olive’s research about a year ago and and was planning to incorporate his predictive formula in to my own tests as a means to help objectively determine a "value". It’s great you’ve used his works in your own efforts because if/when I do the same we will have even more to compare against.
Also, using your list here, I created a price vs performance graphic as a means to objectively determine the "value" of the speakers. I don’t necessarily know if I feel comfortable with such a “black and white” (blue and green, ha!) analysis but it’s interesting nonetheless and I thought I’d share the results. If you find it useful, it might be worth incorporating in to your plots. Just a simple $/performance calc.
- Erin
View attachment 48751
This is great, thanks. Maybe you could start a new thread with these charts in? As I asked both @MZKM and @pozz but neither of them want to include these rankings in their charts. Personally I think they're very interesting and could be of use to consumers. (By the way, I think something's gone wrong with the 'with LFX' chart, doesn't look right from the few speakers I checked.)
Similar threads
- Replies
- 92
- Views
- 12K
- Replies
- 56
- Views
- 7K
- Replies
- 2
- Views
- 2K
- Replies
- 12
- Views
- 2K