• WANTED: Happy members who like to discuss audio and other topics related to our interest. Desire to learn and share knowledge of science required. There are many reviews of audio hardware and expert members to help answer your questions. Click here to have your audio equipment measured for free!

Master Preference Ratings for Loudspeakers

OP
M

MZKM

Major Contributor
Forum Donor
Joined
Dec 1, 2018
Messages
4,251
Likes
11,557
Location
Land O’ Lakes, FL
One problem here is the breakdown view is visually misleading, as all four variables have the same scaling in this view, yet they have different weightings in the actual formula. So a small percentage difference in LFX for example has a comparatively large effect on the final score, whereas the same percentage difference in SM_PIR doesn't have as much of an effect. The radar plots don't currently account for this.

@MZKM would it be possible to instead of using a circular radar plot, have an asymmetrical quadrilateral plot, with the distance from the centre to each variable's 'maximum' vertex proportional to that variable's weighting in the formula? If that's not possible, the next best thing would be to use the current plot layout but simply adjust the variable values according to their formula weighting. Although this second option would not visually depict the maximum weighted quadrilateral, it would allow for visually better comparisons between variable values of different speakers, that are more representative of each variable's relative influence on total preference.

Also, the 'Best' value for NBD_PIR is not 0 as you use to calculate the percentage NBD_PIR score for the radar plot, it's more like 0.15 as I showed here using ideal dummy data with a perfectly plat PIR with a slope matching the ideal target of -1.75. (Note this 0.15 value is not exact, as I just used trial and error - the slope I got was actually -1.746. Maybe you can calculate an exact value for NBD_PIR (Best), working backwards from an exact sope of -1.75.)
Not sure how to incorporate the weighting into the radar chart.

I can make the NBD_PIR go to 0 by using the offset of the ideal slope. But, if we still feel this is harmful as Olive doesn’t state to do this (yet states to use an offset for Smoothness which does not effect the score), then I’ll currently keep it as is with that ~0.15 being the best.
@Sean Olive
 
Last edited:

pozz

Слава Україні
Forum Donor
Editor
Joined
May 21, 2019
Messages
4,036
Likes
6,827
This is great, thanks. Maybe you could start a new thread with these charts in? As I asked both @MZKM and @pozz but neither of them want to include these rankings in their charts. Personally I think they're very interesting and could be of use to consumers. (By the way, I think something's gone wrong with the 'with LFX' chart, doesn't look right from the few speakers I checked.)
You find the scatterplot @MZKM made insufficient?

The main reason to avoid ranking these speakers even further is to make sure that the user of this information takes the time to learn what it all means.
 
OP
M

MZKM

Major Contributor
Forum Donor
Joined
Dec 1, 2018
Messages
4,251
Likes
11,557
Location
Land O’ Lakes, FL
You find the scatterplot @MZKM made insufficient?

The main reason to avoid ranking these speakers even further is to make sure that the user of this information takes the time to learn what it all means.
Yeah, does a score of 5 for $500 mean it’s the same as a score of 7 for $700? There are diminishing returns for audio improvement (as well as most any thing else), so a speaker costing an 8 but for $900 would then be punished using that ranking.

The scatter plot in my opinion is not deceptive and clearly shows if there are similar performers for cheaper, or better performers for the same money.
 

spacevector

Addicted to Fun and Learning
Forum Donor
Joined
Dec 3, 2019
Messages
553
Likes
1,003
Location
Bayrea
Hello, is there a way to "look under the hood" for the preference score calculations?
I follow this link and it shows the Preference Score sheet for all speakers : https://docs.google.com/spreadsheet...4i_eE1JS-JQYSZy7kCQZMKtRnjTOn578fYZPJ/pubhtml

Clicking individual speaker model takes to another page with the plots for the speaker itself. Is it possible to see how the calculations for preference score and breakdown (NBD_ON, NBD_PIR, etc) are performed?
 
OP
M

MZKM

Major Contributor
Forum Donor
Joined
Dec 1, 2018
Messages
4,251
Likes
11,557
Location
Land O’ Lakes, FL
Hello, is there a way to "look under the hood" for the preference score calculations?
I follow this link and it shows the Preference Score sheet for all speakers : https://docs.google.com/spreadsheet...4i_eE1JS-JQYSZy7kCQZMKtRnjTOn578fYZPJ/pubhtml

Clicking individual speaker model takes to another page with the plots for the speaker itself. Is it possible to see how the calculations for preference score and breakdown (NBD_ON, NBD_PIR, etc) are performed?
I’m sharing the sheets in those select graphs. I can’t do that and share another of the whole thing. I can make a duplicate and share that. That’s a pain, so not going to do that every time, but if you have specific speakers you want the full data for, I can do that.

Here is my master sheet. The first four tabs are where I import the data files, everything else is calculations and graphs.
 

edechamps

Addicted to Fun and Learning
Forum Donor
Joined
Nov 21, 2018
Messages
910
Likes
3,621
Location
London, United Kingdom

spacevector

Addicted to Fun and Learning
Forum Donor
Joined
Dec 3, 2019
Messages
553
Likes
1,003
Location
Bayrea
I’m sharing the sheets in those select graphs. I can’t do that and share another of the whole thing. I can make a duplicate and share that. That’s a pain, so not going to do that every time, but if you have specific speakers you want the full data for, I can do that.
Thanks. I just want to see how the formulas look behind the scene (graphs). I have seen the patent you have helpfully linked in the past on which these are based. Just looking to see how actual spreadsheet calculations are implemented.
 

spacevector

Addicted to Fun and Learning
Forum Donor
Joined
Dec 3, 2019
Messages
553
Likes
1,003
Location
Bayrea
For what it's worth, @MZKM shared a few in a previous post:


Presumably the spreadsheets for the other speakers contain the same formulae, only the input data changes.
Oh sweet this is precisely what I was looking for and missed somehow in browsing the many threads. Appreciate the links!
 

bobbooo

Major Contributor
Joined
Aug 30, 2019
Messages
1,479
Likes
2,079
Not sure how to incorporate the weighting into the radar chart.

Here you go. I weighted the variable values according to their percentage contribution to the model as Olive stated in his paper (Table 4), and added the (again weighted) plot of an ideal speaker with a maximum score (which also acts to show the % contribution of each variable to the final preference rating). I think that would make for a more accurate and useful chart when comparing relative merits of different speakers.

I can make the NBD_PIR go to 0 by using the offset of the ideal slope. But, if we still feel this is harmful as Olive doesn’t state to do this (yet states to use an offset for Smoothness which does not effect the score), then I’ll currently keep it as is with that ~0.15 being the best.

Yes I think keeping it as is with ~0.15 is best. You could include the PIR slope for each speaker in your 'Specs' tab though, in the form of the measured slope minus the target slope (i.e. -1.75). Doing it this way would give you the deviation from the ideal target slope, with a positive value being brighter than ideal, and a negative value being darker (the same as the way Olive describes slope values in his paper).
 
Last edited:

bobbooo

Major Contributor
Joined
Aug 30, 2019
Messages
1,479
Likes
2,079
You find the scatterplot @MZKM made insufficient?

The main reason to avoid ranking these speakers even further is to make sure that the user of this information takes the time to learn what it all means.

Yeah, does a score of 5 for $500 mean it’s the same as a score of 7 for $700? There are diminishing returns for audio improvement (as well as most any thing else), so a speaker costing an 8 but for $900 would then be punished using that ranking.

The scatter plot in my opinion is not deceptive and clearly shows if there are similar performers for cheaper, or better performers for the same money.

Don't get me wrong, I think the Price: Performance scatter plots are great, especially for showing general trends - it's early days, but it looks like we might finally have a part of the audio reproduction chain for which sound quality actually correlates with price! I wish the same could be said for headphones (both in-ear and around-ear) or audio electronics (great work on that @pozz).

I don't think trying to avoid a minority of people misunderstanding data/charts is a good reason not to post them though. Much more complex and easily misinterpreted graphs and data are posted on here all the time in the reviews etc. I think an additional Price/Performance (or inversely Performance/Price) chart allows for easily seeing the performance you're getting per $ spent, as well as seeing if this metric reveals any patterns among speaker technologies / form factors / brands etc. (the latter potentially distinguishing honest companies selling decent products at reasonable prices from those ripping-off consumers), none of which can be easily seen using the scatterplots (which do have their own merit though and should be kept). As long as it's made clear these new charts are merely an indicator of value for money (which is of course partially contextual and subjective), and not a definitive value score, they won't be deceptive. The audience on here aren't stupid, they can work it out.
 
Last edited:

pozz

Слава Україні
Forum Donor
Editor
Joined
May 21, 2019
Messages
4,036
Likes
6,827
Don't get me wrong, I think the Price: Performance scatter plots are great, especially for showing general trends - it's early days, but it looks like we might finally have a part of the audio reproduction chain for which sound quality actually correlates with price! I wish the same could be said for headphones (both in-ear and around-ear) or audio electronics (great work on that @pozz).

I don't think trying to avoid a minority of people misunderstanding data/charts is a good reason not to post them though. Much more complex and easily misinterpreted graphs and data are posted on here all the time in the reviews etc. I think an additional Price/Performance (or inversely Performance/Price) chart allows for easily seeing the performance you're getting per $ spent, as well as seeing if this metric reveals any patterns among speaker technologies / form factors / brands etc. (the latter potentially distinguishing honest companies selling decent products at reasonable prices from those ripping-off consumers), none of which can be easily seen using the scatterplots (which do have their own merit though and should be kept). As long as it's made clear these new charts are merely an indicator of value for money (which is of course partially contextual and subjective), and not a definitive value score, they won't be deceptive. The audience on here aren't stupid, they can work it out.
I have had this exact conversation before about SINAD/$ and output power/$ previously. This data can easily make its way outside of ASR and sit without context.

The second thing is that the performance units themselves aren't that, they are units of assumed preference. This may seem like a minor thing but a case could be made that we're misapplying the formula by saying that it's determining performance as such. At least the log scaling that MZKM used in the scatterplots helps to simplify wide price disparities.

In any case the debate will be a lot more productive once we have more entries to deal with.
 

bobbooo

Major Contributor
Joined
Aug 30, 2019
Messages
1,479
Likes
2,079
I have had this exact conversation before about SINAD/$ and output power/$ previously. This data can easily make its way outside of ASR and sit without context.

The second thing is that the performance units themselves aren't that, they are units of assumed preference. This may seem like a minor thing but a case could be made that we're misapplying the formula by saying that it's determining performance as such. At least the log scaling that MZKM used in the scatterplots helps to simplify wide price disparities.

In any case the debate will be a lot more productive once we have more entries to deal with.

Then just call it Predicted Preference per Dollar. All graphs and charts can be taken out of context and misinterpreted by people ignorant of the science behind them. That's no reason to prevent informed people from benefitting from the useful information they do show. Anyway, looks like we'll have to agree to disagree on this for now.

I agree though that these charts would probably show their real utility once we have several products from the same brands measured, which may reveal patterns of honest pricing or ripping off consumers from certain companies, as we've seen in the audio electronics sector.
 

tuga

Major Contributor
Joined
Feb 5, 2020
Messages
3,984
Likes
4,285
Location
Oxford, England
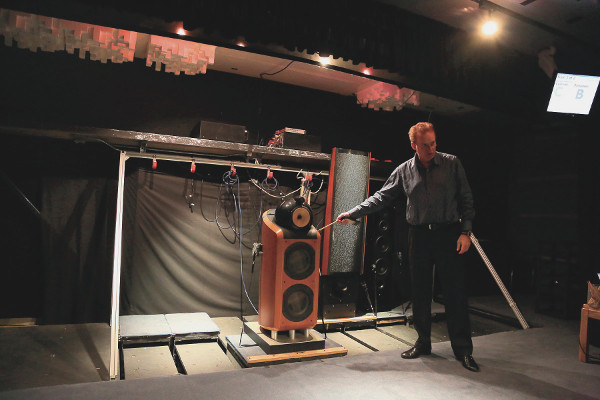
I was re-reading a piece by Floyd Toole (Audio Critic) and found this image:

a300tQ1.png


Does this mean that the blind listening tests used to determine listener preference didn't take into account that different speakers require different positions in the room in order to perform at their best?
Was the signal feeding the loudspeakers high-passed?

051016_olive_in_lab.jpg
 
OP
M

MZKM

Major Contributor
Forum Donor
Joined
Dec 1, 2018
Messages
4,251
Likes
11,557
Location
Land O’ Lakes, FL
Listening tests wouldn’t be high passed.

Different speakers don’t “require“ different distances from the front wall. Since SBIR would be nearly the same, the only thing distance from front wall will effect between models is how wide the soundstage is in the mid-bass. A speaker with a lower directivity index will have a wider soundstage but less precise imaging in the mid-bass.
 

tuga

Major Contributor
Joined
Feb 5, 2020
Messages
3,984
Likes
4,285
Location
Oxford, England
Listening tests wouldn’t be high passed.

Different speakers don’t “require“ different distances from the front wall. Since SBIR would be nearly the same, the only thing distance from front wall will effect between models is how wide the soundstage is in the mid-bass. A speaker with a lower directivity index will have a wider soundstage but less precise imaging in the mid-bass.

So a speaker which was designed to be boundary coupled doesn't require a specific distance from the front wall?
What about floor-bounce cancellation, doesn't that vary from speaker to speaker?
 
OP
M

MZKM

Major Contributor
Forum Donor
Joined
Dec 1, 2018
Messages
4,251
Likes
11,557
Location
Land O’ Lakes, FL
So a speaker which was designed to be boundary coupled doesn't require a specific distance from the front wall?
What about floor-bounce cancellation, doesn't that vary from speaker to speaker?
How many speakers are designed like that?

I believe Toole has said that floor/ceiling reflections are of mild impact, that we are pretty good at filtering it out (and that it sounds off if it’s heavily absorbed).

A well designed speaker though would have good vertical off-axis performance, so the floor/ceiling bounce would be similar in tonal balance.
 

Sancus

Major Contributor
Forum Donor
Joined
Nov 30, 2018
Messages
2,926
Likes
7,643
Location
Canada
I have a question about the score that ignores LFX. If I'm reading the definitions correctly, the LFX score is Log10 of the -6db point below 300hz. And the way this is "ignored" is basically giving it the equivalent of a perfectly crossed over sub with a -6db point of 15hz. OK. Fair enough. My problem with this is that it seems to be unrealistically generous to speakers with very poor bass response. If you had a speaker with a -6db point of 120hz for example, that would count for nothing against a speaker with that point at 60hz.

Most people don't want their subs playing a significant amount of localizable bass, however. So in fact having a speaker that can be realistically crossed over with a sub under 80hz is important, and the score ignoring LFX doesn't take this into account.

The main reason I think this is an issue is people seem to be using the "score ignoring LFX" as a default proxy for "what I would get as long as I'm using a sub", but it isn't that, because it assumes crossover frequencies that aren't realistic or desirable.
 

tuga

Major Contributor
Joined
Feb 5, 2020
Messages
3,984
Likes
4,285
Location
Oxford, England
How many speakers are designed like that?

I believe Toole has said that floor/ceiling reflections are of mild impact, that we are pretty good at filtering it out (and that it sounds off if it’s heavily absorbed).

A well designed speaker though would have good vertical off-axis performance, so the floor/ceiling bounce would be similar in tonal balance.

This is the Quad ELS63:

QGA9joD.jpg
 

tuga

Major Contributor
Joined
Feb 5, 2020
Messages
3,984
Likes
4,285
Location
Oxford, England
How many speakers are designed like that?

I believe Toole has said that floor/ceiling reflections are of mild impact, that we are pretty good at filtering it out (and that it sounds off if it’s heavily absorbed).

A well designed speaker though would have good vertical off-axis performance, so the floor/ceiling bounce would be similar in tonal balance.

Will you accept views from other designers?


bobbooo

Major Contributor
Joined
Aug 30, 2019
Messages
1,479
Likes
2,079
I have a question about the score that ignores LFX. If I'm reading the definitions correctly, the LFX score is Log10 of the -6db point below 300hz. And the way this is "ignored" is basically giving it the equivalent of a perfectly crossed over sub with a -6db point of 15hz. OK. Fair enough. My problem with this is that it seems to be unrealistically generous to speakers with very poor bass response. If you had a speaker with a -6db point of 120hz for example, that would count for nothing against a speaker with that point at 60hz.

Most people don't want their subs playing a significant amount of localizable bass, however. So in fact having a speaker that can be realistically crossed over with a sub under 80hz is important, and the score ignoring LFX doesn't take this into account.

The main reason I think this is an issue is people seem to be using the "score ignoring LFX" as a default proxy for "what I would get as long as I'm using a sub", but it isn't that, because it assumes crossover frequencies that aren't realistic or desirable.

This won't be a problem in the vast majority of cases. As this paper showed, a crossover frequency of 120 Hz is not localizable, with half of the listeners not even being able to localize the subwoofers at the highest crossover frequency tested of 227 Hz. Anecdotally, I've read that the often quoted standard crossover of 80 Hz was recommended by THX partially because it was two standard deviations below the lowest frequency localizable, just to be sure. Consider also that the LFE (Low Frequency Effects) channel on movie soundtracks goes up to 120 Hz, which is specifically for subwoofers, definitely not intended to be localizable, so this frequency was most likely chosen for a reason. The speaker with the worst bass extension so far is the abysmal (preference rating of -0.6!) Realistic MC-100 with an LFX point at 109 Hz, so even this would likely be able to be crossed over with a sub without it being localizable.

(By the way, @MZKM I've just spotted that the SPL Specs tab for the Selah speaker says it has a -3 dB point of 20 kHz! Not sure what went wrong there :D)
 
Last edited:
Top Bottom