
Weeb Labs
Addicted to Fun and Learning
EDIT 13/12/21: Updated with full spin and other fun things.
I recently purchased a pair of Mackie MR524s and thought it might be helpful to capture a set of essential measurements. To my knowledge, none are currently available.
The MR524 is sold individually for approximately €100, which places it within the same price bracket as the JBL 305P, Adam T5V and KRK Rokit 5. I find them to be rather aesthetically pleasing and many of the product images online fail to do them justice.
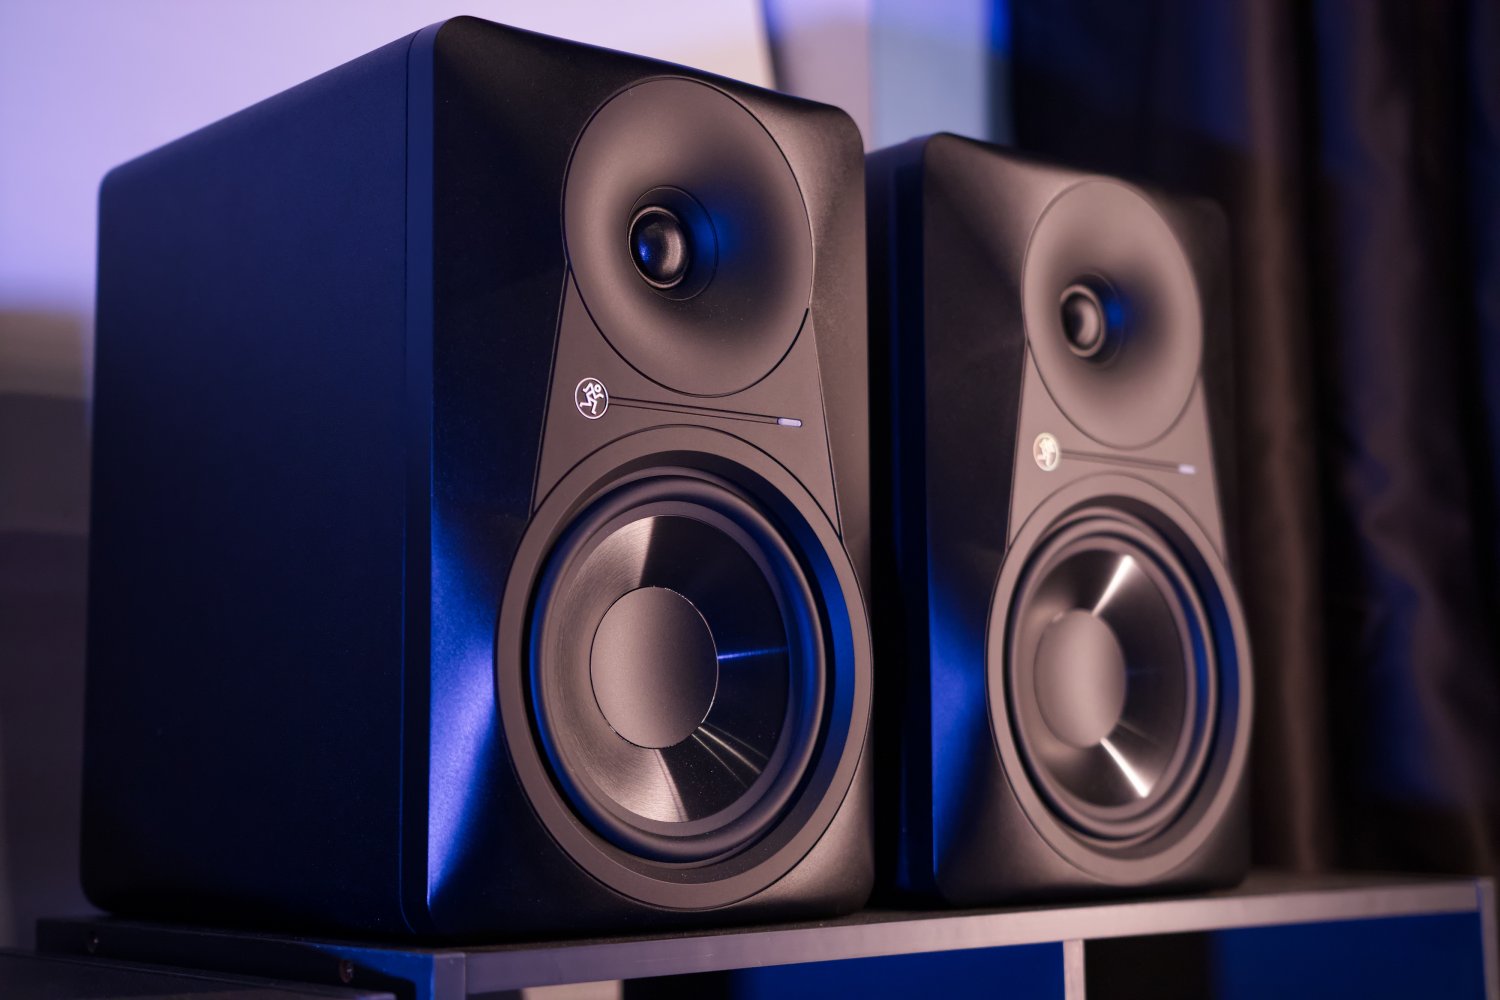
I love the inverted dust cap!

The rear is populated with a handy selection of RCA, TRS and XLR inputs. There are also three onboard PEQ settings, a three-position HF adjustment switch and input gain control with the unity point marked. The HF adjustment switch is best left in the -2dB position, as we will soon discover.
Firstly, we have the on-axis and off-axis measurements. These are a composite of nearfield and gated methods, which should be reasonably comparable to measurements acquired using a Klippel NFS or anechoic chamber.

On-axis response is predominantly flat, with a little bit of additional bass and a bump around 10KHz. Directivity is excellent, which will enable effective correction of the on-axis response via EQ or DRC.
In-room response displays a rise at higher frequencies, which will sound rather "bright".

Moving the HF adjustment switch to the -2dB position produces a significantly flatter response, so this is the configuration that I would recommend.

Next, we have nearfield measurements of all driver components.

We have a rather loud port resonance at 1KHz, so if using these monitors in conjunction with a subwoofer, you may wish to plug the port. The midbass response also dips just above the crossover, which is likely responsible for the briefly narrowed directivity at that point.
Next, polar and line charts for directivity. Horizontal directivity is quite wide and uniform, with approximately 45 degrees of freedom up to 15KHz.

You will definitely want to remain within about 25 degrees on the vertical axis. This likely results from the driver separation being somewhat larger than is typical, despite being less than a wavelength apart at the crossover. If you must listen off-axis, prefer above to below.


Finally, we have harmonic distortion. This measurement is subject to room interaction and so accuracy is always questionable.

Subjective impressions were very positive. The 10KHz bump is readily apparent but easily corrected with a gentle filter and at that point, they sound just as lovely as my T5Vs and LSR 305s. Quiet Light from Hanaregumi is one of my favorite test tracks and it sounds delightful on these; especially in conjunction with Audiolense correction!")
Thank you for reading and I hope this thread has been of help to you.
I recently purchased a pair of Mackie MR524s and thought it might be helpful to capture a set of essential measurements. To my knowledge, none are currently available.
The MR524 is sold individually for approximately €100, which places it within the same price bracket as the JBL 305P, Adam T5V and KRK Rokit 5. I find them to be rather aesthetically pleasing and many of the product images online fail to do them justice.
I love the inverted dust cap!
The rear is populated with a handy selection of RCA, TRS and XLR inputs. There are also three onboard PEQ settings, a three-position HF adjustment switch and input gain control with the unity point marked. The HF adjustment switch is best left in the -2dB position, as we will soon discover.
Firstly, we have the on-axis and off-axis measurements. These are a composite of nearfield and gated methods, which should be reasonably comparable to measurements acquired using a Klippel NFS or anechoic chamber.
On-axis response is predominantly flat, with a little bit of additional bass and a bump around 10KHz. Directivity is excellent, which will enable effective correction of the on-axis response via EQ or DRC.
In-room response displays a rise at higher frequencies, which will sound rather "bright".
Moving the HF adjustment switch to the -2dB position produces a significantly flatter response, so this is the configuration that I would recommend.
Next, we have nearfield measurements of all driver components.
We have a rather loud port resonance at 1KHz, so if using these monitors in conjunction with a subwoofer, you may wish to plug the port. The midbass response also dips just above the crossover, which is likely responsible for the briefly narrowed directivity at that point.
Next, polar and line charts for directivity. Horizontal directivity is quite wide and uniform, with approximately 45 degrees of freedom up to 15KHz.
You will definitely want to remain within about 25 degrees on the vertical axis. This likely results from the driver separation being somewhat larger than is typical, despite being less than a wavelength apart at the crossover. If you must listen off-axis, prefer above to below.
Finally, we have harmonic distortion. This measurement is subject to room interaction and so accuracy is always questionable.
Subjective impressions were very positive. The 10KHz bump is readily apparent but easily corrected with a gentle filter and at that point, they sound just as lovely as my T5Vs and LSR 305s. Quiet Light from Hanaregumi is one of my favorite test tracks and it sounds delightful on these; especially in conjunction with Audiolense correction!
Thank you for reading and I hope this thread has been of help to you.
NOTE: If making use of either these filters or the attached WAV IR, please ensure that the "Acoustic Space" and "High Freq Filter" switches on the rear of the monitors are in the "0dB" position".
| Filter (#) | Frequency (Hz) | Gain (dB) | Width (Q) | Width (BW) |
| 1 | 102.12 | -2.93 | 1.24 | 1.13 |
| 2 | 939.68 | -2.22 | 4.37 | 0.32 |
| 3 | 1270.67 | 1.18 | 2.92 | 0.49 |
| 4 | 1922.01 | -2.39 | 2.70 | 0.53 |
| 5 | 5153.60 | -2.29 | 1.31 | 1.07 |
| 6 | 9866.26 | -4.67 | 2.94 | 0.48 |
| 7 | 16694.51 | -3.88 | 3.43 | 0.41 |
Attachments
Last edited:


