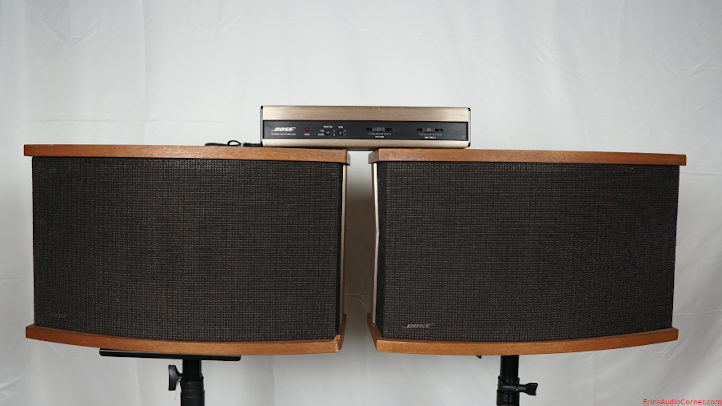
It is done! I completed the Bose 901 Series V speaker review and have posted it to my website. I am copying/pasting the majority of it here but go to the site if you want to read everything (or if links don't work here, etc).
https://www.erinsaudiocorner.com/loudspeakers/bose_901_series_v/
I'm proud of this one. Lots of work and time went in to creating this. About 20 hours so far. But I learned a lot and hopefully others will, too.
This speaker is definitely getting a YouTube review. There's no way to go through everything I want to say without spending several more hours.
Bose 901 Series V Speaker Review
Intro
A few things that need to be stated up front before people skip this and go to the pictures:
Moving on…
The Bose 901 has been around for 50+ years and has long been considered a divisive product within the audiophile community. I was born in 1982 and until this week I had never heard the Bose 901 speakers. I’d just heard about them. Everything we all have heard and read. The same old clichés. Some love them. Some love the nostalgia of them. Some despise them and everything they represent; from the company to the product performance and how it colors (no pun intended) listeners’ perception of what good sound is supposed to be.
There have been some who have provided measurements of these speakers (NoAudiophile did here). However, there are no measurements that replicate anechoic data. Additionally, with the gaining popularity of the CEA/CTA-2034 method of providing a complete set of measurements and a prediction for in-room performance based on Floyd Toole’s work, I couldn’t stop wondering not only how the 901 would sound to me but also how they would fare in the CTA-2034 standard set of curves. Long story short, a fellow forum member of AudioScienceReview was kind enough to send me his pair of Bose 901 Series V speakers. Funny side story: he was going to send the Series IV he owned but had issues when it came time to refoam them so he sourced a very good condition pair of Series V’s and shipped them to me. Given the Series VI is the last production model and that the Series V and IV (apparently) only differ in cosmetic fashion, I was happy to have the “latest” 901 version to test.
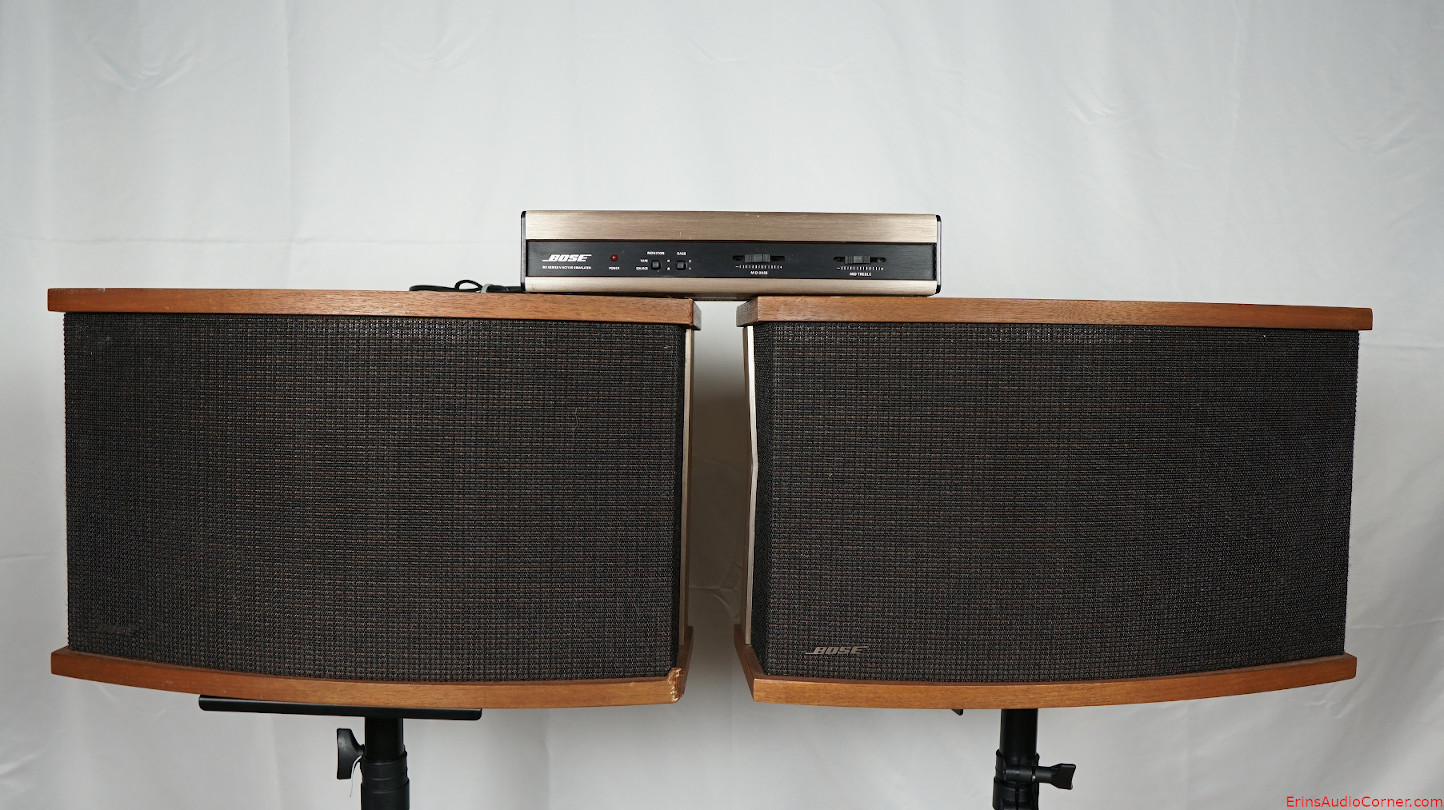
This version consists of a single “full range” 4.5 inch driver up front and 8… yes, 8… 4.5 full range drivers in the back. The idea is to place these near a rear-wall and the 8 speakers in the back would create an enveloping sound. Well, they certainly do that. But, as you can imagine, they are not what I would consider accurate or reference speakers. Still, they’re novel and I rather enjoy the novelty. I get why people hate them. I also understand why people love them. If I had endless money and space, I’d love to have these in a dedicated room as an alternative to a reference system. Something to go in to, plop down in a big comfy chair and just kick back and enjoy these for what they are: a novelty speaker that does bring a grin to my face.
I’ll get back to my subjective thoughts later but for now let’s move on to the data.
Foreword: Subjective Analysis vs Objective Data (click for more)
Product Specs and Photos
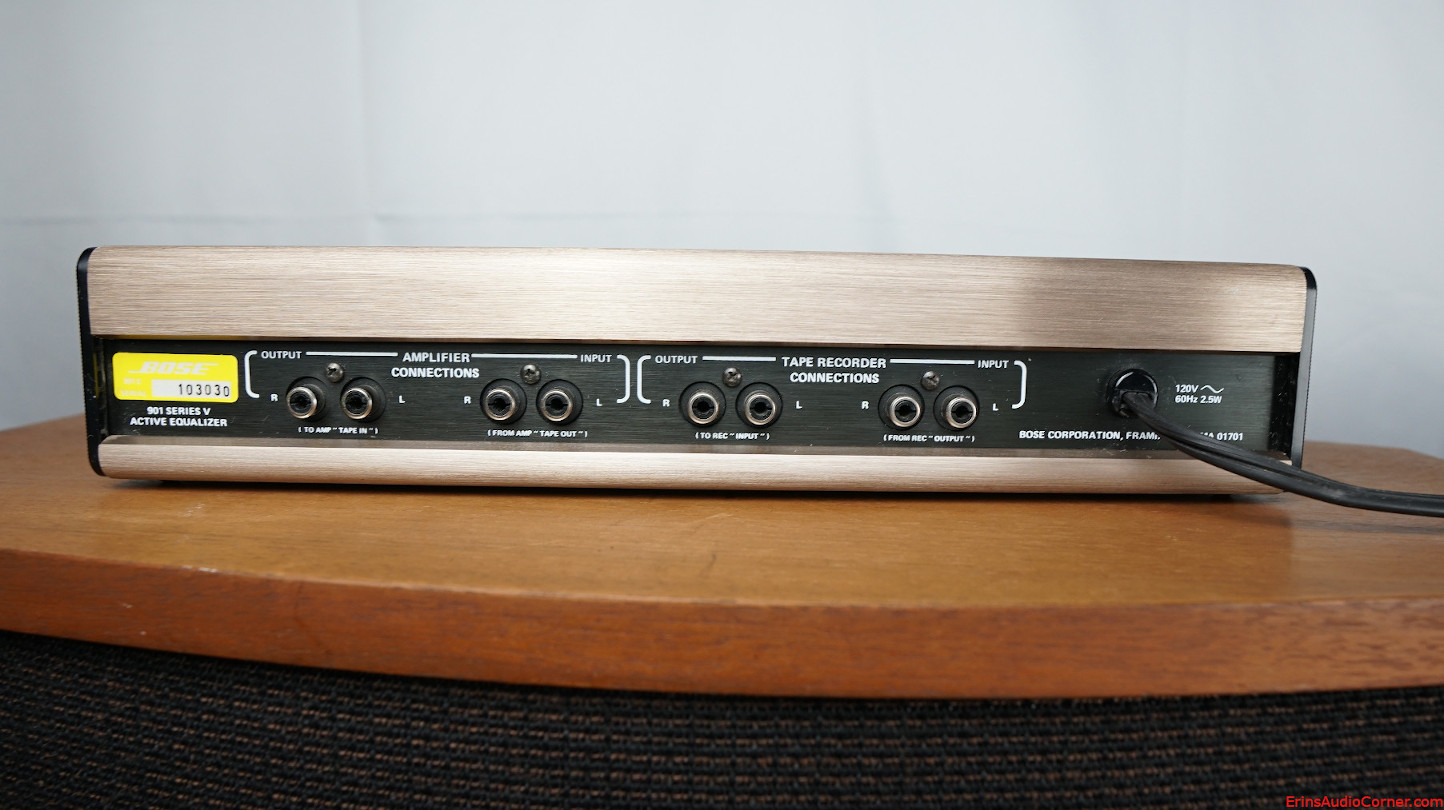
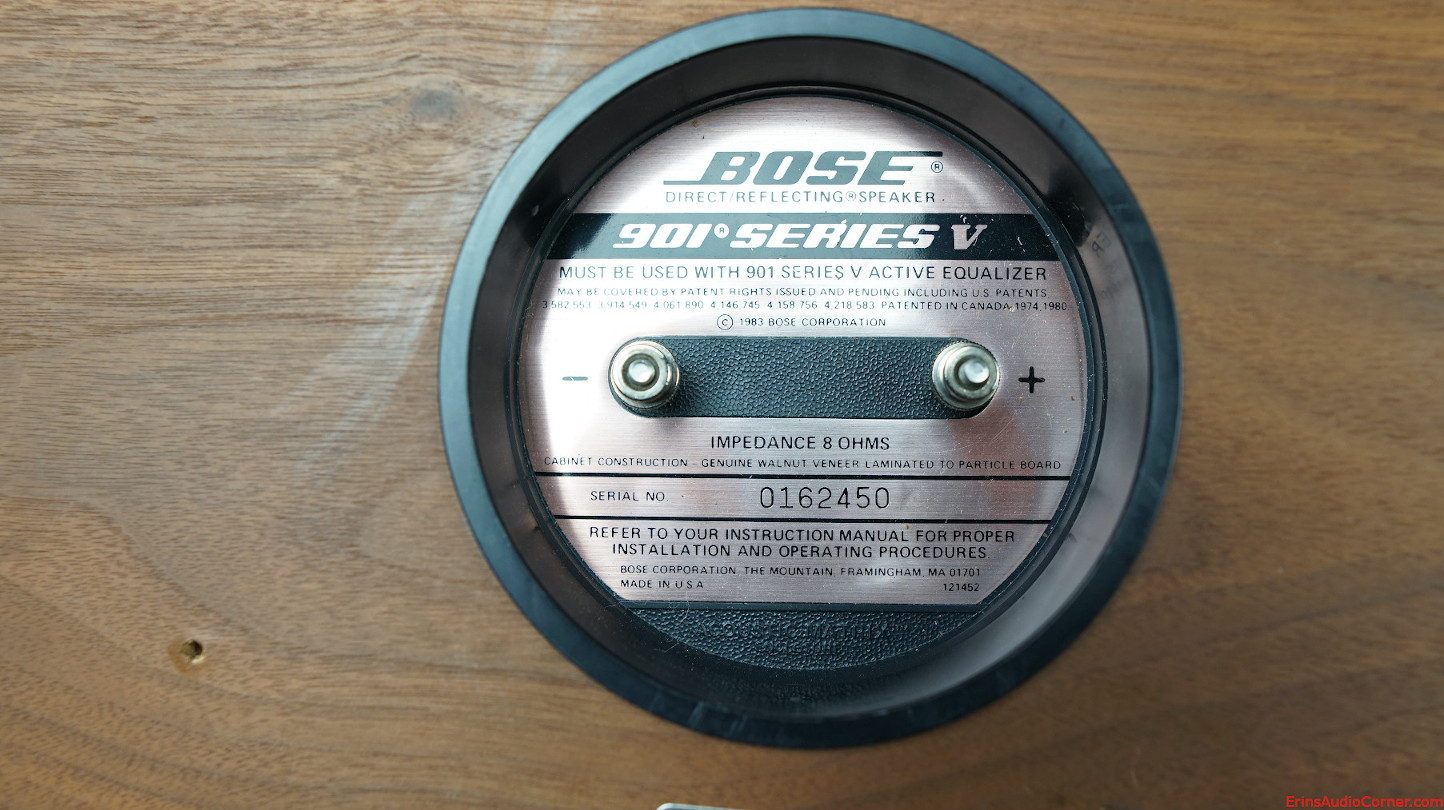
Objective Data
Before I dive into the test, let me reiterate the fact this speaker has a multitude of EQ options. I tested the speaker “raw”, primarily. I also tested with the EQ in-line varying the settings. So, again, please read the title of each graphic because these tell you what was measured in that particular instance.
When the graph says “No EQ” that means there was No EQ In-Line for the measurement. In other words, this is a raw speaker measurement.
Unless otherwise noted, all the data below was captured using Klippel Distortion Analyzer 2 and Klippel modules (TRF, DIS, LPM, ISC to name a few). Most of the data was exported to a text file and then graphed using my own MATLAB scripts in order to present the data in a specific way I prefer. However, some is given using Klippel’s graphing.
EQ Box Testing
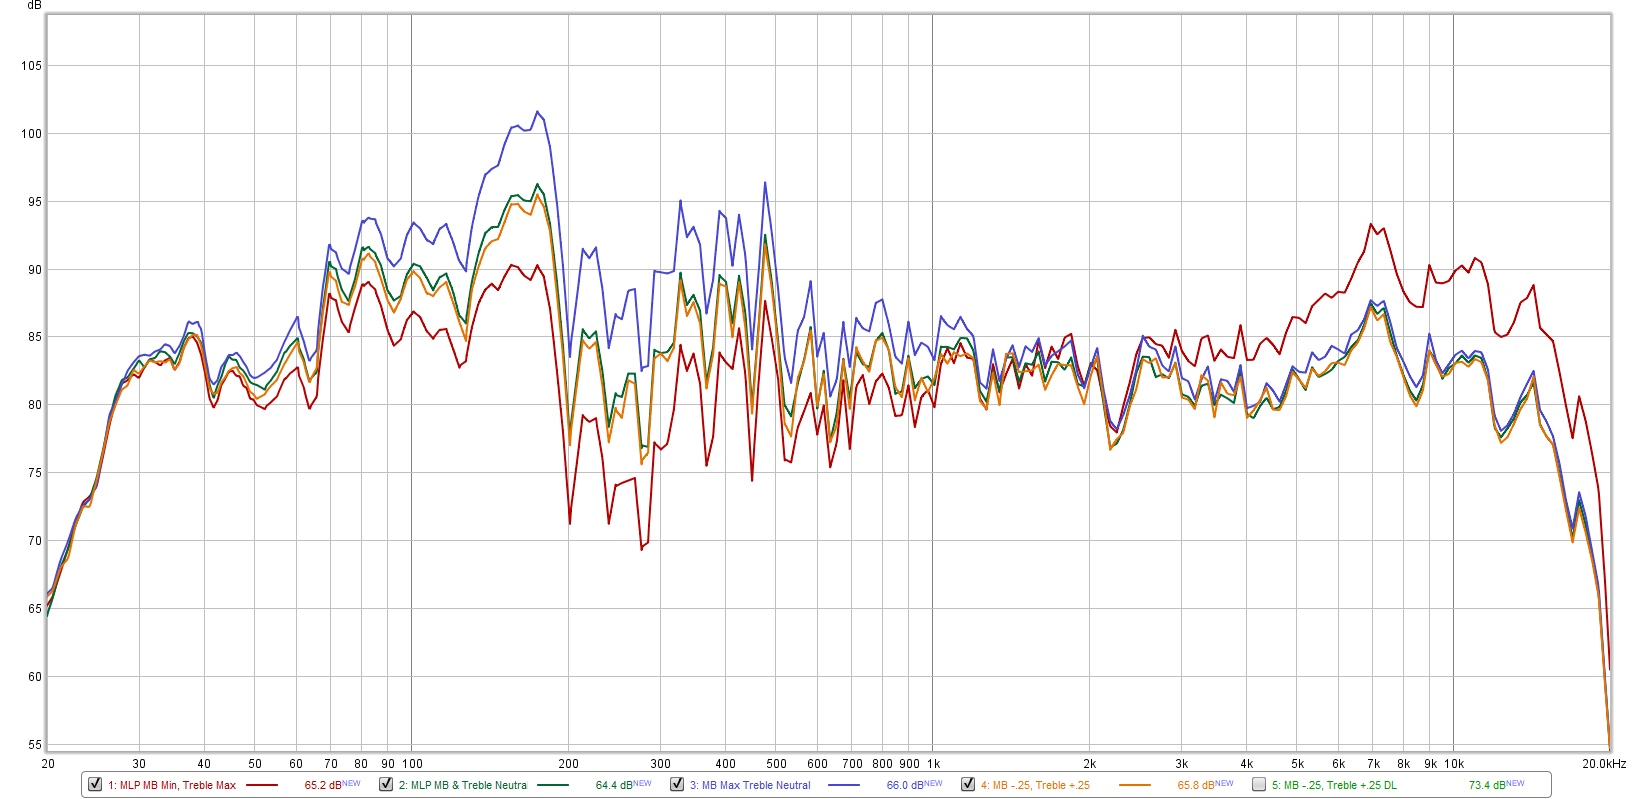
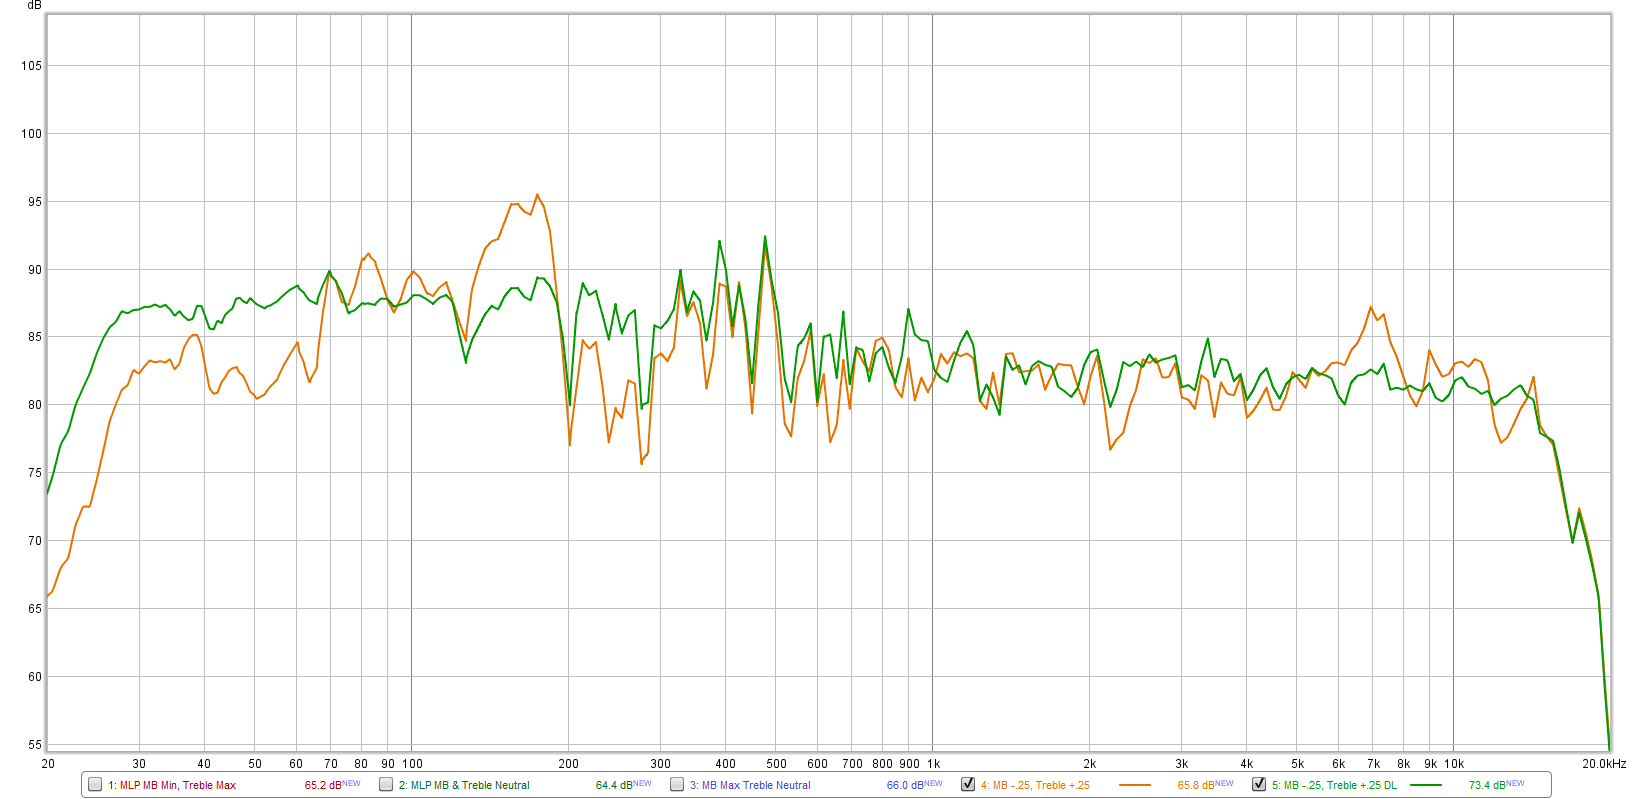
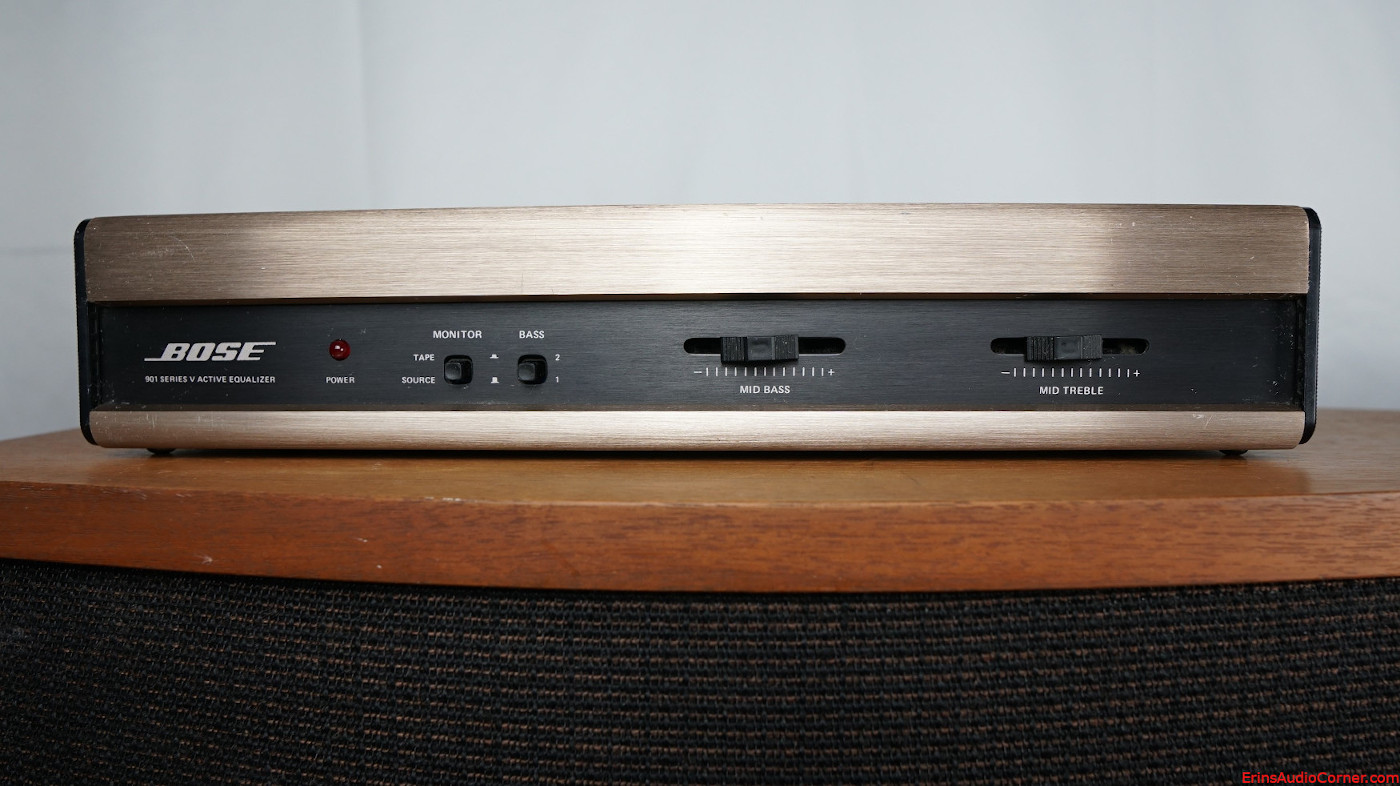
I used Klippel’s Distortion Analyzer 2 to capture the Bose 901 Series V’s various EQ settings. As you can see from the above photo of the EQ box there are various slider positions for “Mid Bass” and “Mid Treble”. There is also a “Bass” setting which accentuates the lower bass. I have provided two graphics below showing 1) difference between “Bass 1” and “Bass 2” (when EQ is set to the Neutral position) and 2) the comparison of the MidBass and MidTreble sliders (with Bass = 2).
As you can see below, the “Bass” button boosts the LF response another 5dB or so.
/Bose%20901%20Series%20V%20Equalizer%20Settings%20Bass1%20vs%20Bass2.png)
These are a sampling of the various EQ slider positions, where Bass = 2. The yellow line is the “EQ Neutral” setting; meaning the EQ sliders were at the middle detent … I also refer to this as “flat”, even though it’s not electrically flat… it’s just the default setting. As you can see, there is a lot of swing available on both ends and the 1kHz region is the closest to the same any of these settings comes to.
/Bose%20901%20Series%20V%20Equalizer%20Settings.png)
Impedance Phase and Magnitude
Impedance measurements are provided both at 0.10 volts RMS and 2.83 volts RMS. The low-level voltage version is standard because it ensures the speaker/driver is in linear operating range. The higher voltage is to see what happens when the output voltage is increased to the 2.83vRMS speaker sensitivity test. I did measure with the EQ in-line but there was no meaningful difference so I won’t bother sharing the results.
/Bose%20901%20Series%20V%20(No%20EQ)_Impedance_0.1v_&_2.83v.png)
/Bose%20901%20Series%20V%20(No%20EQ)_FR_vs_Impedance_2.83v.png)
From the above data we can see the following:
Frequency Response
Notes about measurements (click for info)
The measurement below provides the frequency response at the reference measurement axis - also known as the 0-degree axis or “on axis” plane - in this measurement condition was situated at the ribbon.
/Bose%20901%20Series%20V%20(No%20EQ)%20FR_Linearity.png)
The mean SPL without EQ in-line is approximately 81dB at 2.83v/1m, calculated over the frequency range of 300Hz to 3,000Hz.
The blue shaded area represents the ±3dB response window from my calculated mean SPL value. As you can see in the blue window above, the Bose 901 Series V sans EQ has a ±3dB response from 62Hz - 20kHz. The ±1.5dB window is even worse. But, it’s a single 4.5” woofer with an off-shaped (by modern standards) baffle. Not making excuses. Just saying.
Now let’s look at a couple other measurements with the EQ in-line. Again, the title tells the EQ setup.
/Bose%20901%20Series%20V%20(Bass%202%20-%20EQs%20Neutral)%20FR_Linearity.png)
/Bose%20901%20Series%20V%20(Bass%202%20-%20Treble%20Min,%20Midbass%20Flat)%20FR_Linearity.png)
Below are both the horizontal and vertical response over a limited window (90° horizontal, ±40° vertical). I have provided a “normalized” set of data as well. The normalization simply means that I took the difference of the on-axis response and compared the other axes’ measurements to the on-axis response which gives the viewer a good idea of the speaker performance, relative to the on-axis response, as you move off-axis.
/Bose%20901%20Series%20V%20(No%20EQ)%20Horizontal%20FR.png)
/Bose%20901%20Series%20V%20(No%20EQ)_Horizontal_FR_Normalized.png)
/Bose%20901%20Series%20V%20(No%20EQ)%20Vertical%20FR.png)
/Bose%20901%20Series%20V%20(No%20EQ)%20Vertical%20FR%20Normalized.png)
As I said above, the provided frequency response graphs were given with a limited set of data. I measured the response of the speaker’s vertical and horizontal axis in 10-degree steps over 360-degrees. Nearly 70 measurements in total are represented in my data. As you can imagine, providing all those data points in a single FR-type graphic below is a bit overwhelming and confusing for the viewer. A spectrogram is an alternate way to view this full set of data. This takes a 360-degree set of data and “collapses” it down to a rectangular representation of the various angles’ SPL. I have provided two sets of data: one set for horizontal and one for vertical. Each set consists of 2 graphics:
/Bose%20901%20Series%20V%20(No%20EQ)_Horizontal_Spectrogram_Full.png)
/Bose%20901%20Series%20V%20(No%20EQ)_Horizontal_Spectrogram__Norm_Full.png)
/Bose%20901%20Series%20V%20(No%20EQ)_Vertical_Spectrogram_Full.png)
/Bose%20901%20Series%20V%20(No%20EQ)_Vertical_Spectrogram_Norm_Full.png)
The above spectrograms are the standard way of providing directivity graphics by most reviewers. Some prefer not to normalize the data. Some prefer to normalize the data. Either way, it’s a useful visual to get an idea of the directivity characteristics of a speaker or driver.
However, these “collapsed” representations of the sound field are not very intuitively viewed. At least not to me. So, I came up with a different way to view the speaker’s horizontal and vertical sound field by providing it across a 360° range in a globe plot below. I have provided both an absolute SPL version as well as a normalized version of both the horizontal and vertical sound fields.
Note the legend provided in the top left of each image which helps you understand speaker orientation provided in my global plots below.
/Bose%20901%20Series%20V%20(No%20EQ)_360_Horizontal_Polar.png)
/Bose%20901%20Series%20V%20(No%20EQ)_360_Horizontal_Polar_Normalized.png)
/Bose%20901%20Series%20V%20(No%20EQ)_360_Vertical_Polar.png)
/Bose%20901%20Series%20V%20(No%20EQ)_360_Vertical_Polar_Normalized.png)
Now let’s look at a couple other measurements with the EQ in-line. Again, the title tells the EQ setup.
This is with the EQ in-line but set to neutral (middle detent).
/Bose%20901%20Series%20V%20(Bass%202%20-%20EQs%20Neutral)_Horizontal_Spectrogram_Full.png)
/Bose%20901%20Series%20V%20(Bass%202%20-%20EQs%20Neutral)_Vertical_Spectrogram_Full.png)
/Bose%20901%20Series%20V%20(Bass%202%20-%20EQs%20Neutral)_360_Horizontal_Polar.png)
/Bose%20901%20Series%20V%20(Bass%202%20-%20EQs%20Neutral)_360_Vertical_Polar.png)
This is with the EQ in-line with the MidBass set to Neutral and the MidTreble set to max.
/Bose%20901%20Series%20V%20(Bass%202%20-%20Treble%20Min,%20Midbass%20Flat)_Horizontal_Spectrogram_Full.png)
/Bose%20901%20Series%20V%20(Bass%202%20-%20Treble%20Min,%20Midbass%20Flat)_Vertical_Spectrogram_Full.png)
/Bose%20901%20Series%20V%20(Bass%202%20-%20Treble%20Min,%20Midbass%20Flat)_360_Horizontal_Polar.png)
/Bose%20901%20Series%20V%20(Bass%202%20-%20Treble%20Min,%20Midbass%20Flat)_360_Vertical_Polar.png)
Bottom line here is the majority of this speaker’s sound is radiated toward the back. Not a real surprise. But very interesting to see how a speaker like this looks in this graphical format.
https://www.erinsaudiocorner.com/loudspeakers/bose_901_series_v/
I'm proud of this one. Lots of work and time went in to creating this. About 20 hours so far. But I learned a lot and hopefully others will, too.
This speaker is definitely getting a YouTube review. There's no way to go through everything I want to say without spending several more hours.
Bose 901 Series V Speaker Review
- Wednesday, Jul 22, 2020

Intro
A few things that need to be stated up front before people skip this and go to the pictures:
- Pay attention to the Title of each graph. This speaker comes with an EQ that has all sorts of various slider positions. I tested the speaker “Raw” (without the EQ in-line) first. Then I tested it with the EQ in-line, with a few different setting configurations. There is a lot to unpack here. The title of each graph tells you how the settings were made. Please pay attention to the titles; otherwise you will get confused as to what is going on.
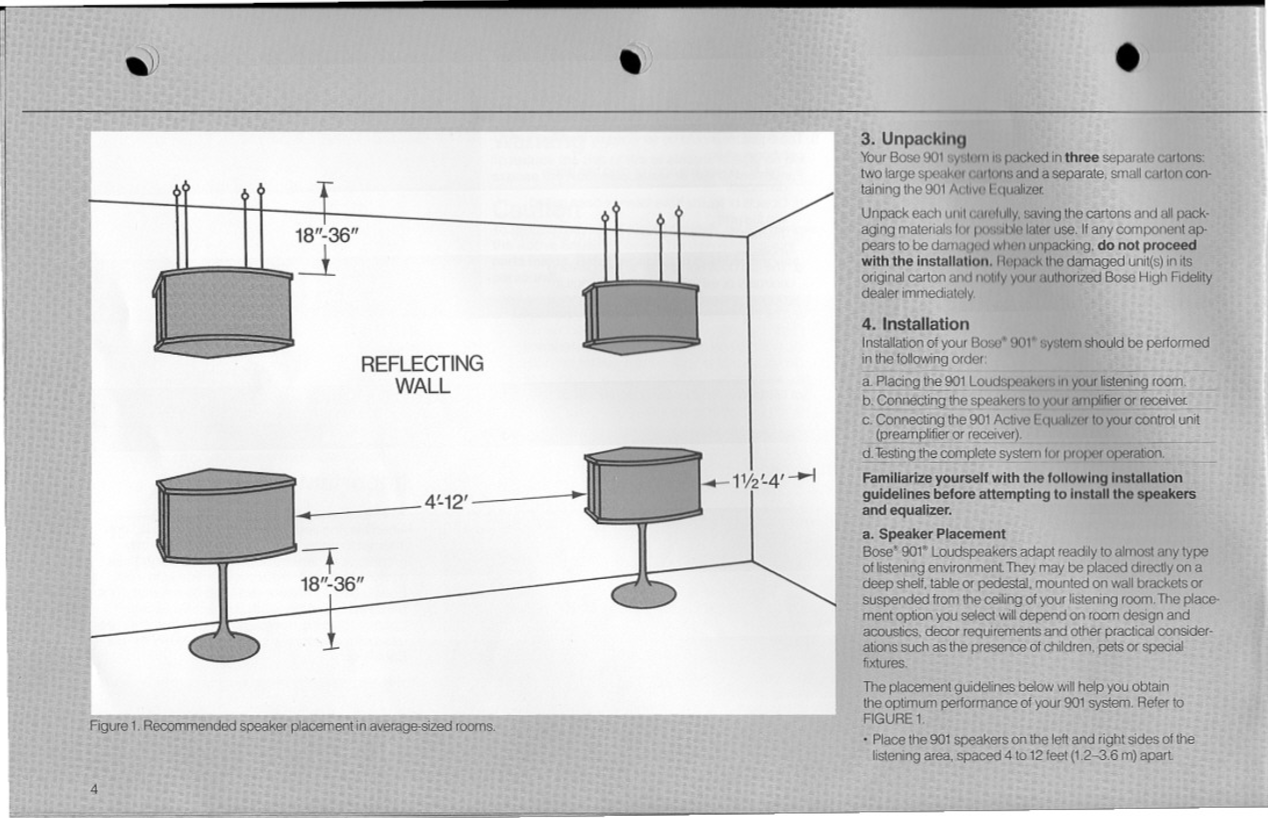
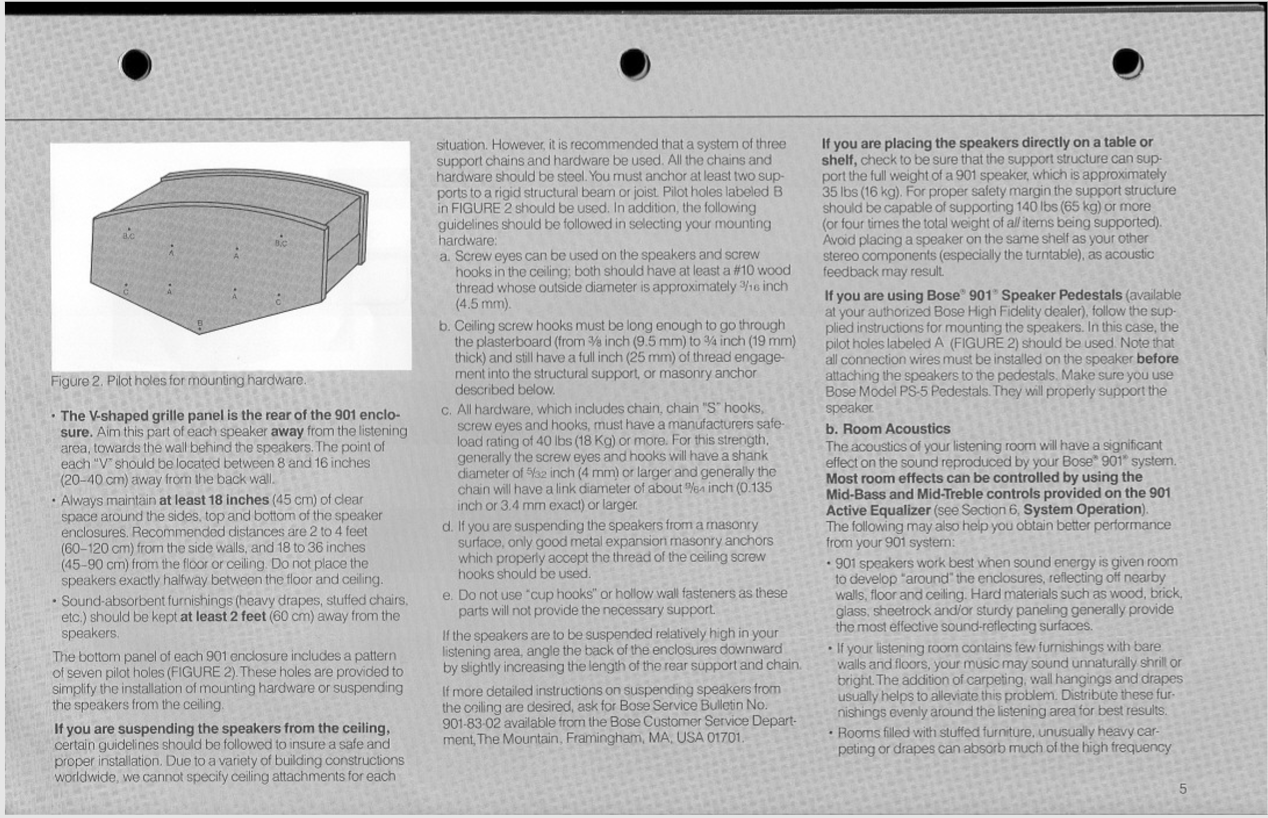
- Some may be concerned that this “Spinorama” data doesn’t take in to affect the speakers needing to be close to a surface. I have attached an image below but to summarize: The speakers should be placed at least 18 inches from side walls (with a recommendation of 2-4 feet from side walls) and 8-16 inches from the rear wall. The “Spinorama” data does not take this into account. And, at this point, I do not know how to manipulate the data in a way to “trick” the Spinorama graphics in to showing what would happen when you place them in the manner they were designed to be placed. Although, one can make the case that the SPL is simply adjusted by +6dB for this proximity and transition from the standard 4-pi reference to a 2-pi reference (free space vs near-wall). That’s just the reality. So, before anyone gets up in arms about this factor; yes, I am fully aware of the potential limitation related to this speaker’s direct/reflective design.
- The EQ was always in-line in my listening sessions.


Moving on…
The Bose 901 has been around for 50+ years and has long been considered a divisive product within the audiophile community. I was born in 1982 and until this week I had never heard the Bose 901 speakers. I’d just heard about them. Everything we all have heard and read. The same old clichés. Some love them. Some love the nostalgia of them. Some despise them and everything they represent; from the company to the product performance and how it colors (no pun intended) listeners’ perception of what good sound is supposed to be.
There have been some who have provided measurements of these speakers (NoAudiophile did here). However, there are no measurements that replicate anechoic data. Additionally, with the gaining popularity of the CEA/CTA-2034 method of providing a complete set of measurements and a prediction for in-room performance based on Floyd Toole’s work, I couldn’t stop wondering not only how the 901 would sound to me but also how they would fare in the CTA-2034 standard set of curves. Long story short, a fellow forum member of AudioScienceReview was kind enough to send me his pair of Bose 901 Series V speakers. Funny side story: he was going to send the Series IV he owned but had issues when it came time to refoam them so he sourced a very good condition pair of Series V’s and shipped them to me. Given the Series VI is the last production model and that the Series V and IV (apparently) only differ in cosmetic fashion, I was happy to have the “latest” 901 version to test.
This version consists of a single “full range” 4.5 inch driver up front and 8… yes, 8… 4.5 full range drivers in the back. The idea is to place these near a rear-wall and the 8 speakers in the back would create an enveloping sound. Well, they certainly do that. But, as you can imagine, they are not what I would consider accurate or reference speakers. Still, they’re novel and I rather enjoy the novelty. I get why people hate them. I also understand why people love them. If I had endless money and space, I’d love to have these in a dedicated room as an alternative to a reference system. Something to go in to, plop down in a big comfy chair and just kick back and enjoy these for what they are: a novelty speaker that does bring a grin to my face.
I’ll get back to my subjective thoughts later but for now let’s move on to the data.
Foreword: Subjective Analysis vs Objective Data (click for more)
Product Specs and Photos


Objective Data
Before I dive into the test, let me reiterate the fact this speaker has a multitude of EQ options. I tested the speaker “raw”, primarily. I also tested with the EQ in-line varying the settings. So, again, please read the title of each graphic because these tell you what was measured in that particular instance.
When the graph says “No EQ” that means there was No EQ In-Line for the measurement. In other words, this is a raw speaker measurement.
Unless otherwise noted, all the data below was captured using Klippel Distortion Analyzer 2 and Klippel modules (TRF, DIS, LPM, ISC to name a few). Most of the data was exported to a text file and then graphed using my own MATLAB scripts in order to present the data in a specific way I prefer. However, some is given using Klippel’s graphing.
EQ Box Testing
I used Klippel’s Distortion Analyzer 2 to capture the Bose 901 Series V’s various EQ settings. As you can see from the above photo of the EQ box there are various slider positions for “Mid Bass” and “Mid Treble”. There is also a “Bass” setting which accentuates the lower bass. I have provided two graphics below showing 1) difference between “Bass 1” and “Bass 2” (when EQ is set to the Neutral position) and 2) the comparison of the MidBass and MidTreble sliders (with Bass = 2).
As you can see below, the “Bass” button boosts the LF response another 5dB or so.
/Bose%20901%20Series%20V%20Equalizer%20Settings%20Bass1%20vs%20Bass2.png)
These are a sampling of the various EQ slider positions, where Bass = 2. The yellow line is the “EQ Neutral” setting; meaning the EQ sliders were at the middle detent … I also refer to this as “flat”, even though it’s not electrically flat… it’s just the default setting. As you can see, there is a lot of swing available on both ends and the 1kHz region is the closest to the same any of these settings comes to.
/Bose%20901%20Series%20V%20Equalizer%20Settings.png)
Impedance Phase and Magnitude
Impedance measurements are provided both at 0.10 volts RMS and 2.83 volts RMS. The low-level voltage version is standard because it ensures the speaker/driver is in linear operating range. The higher voltage is to see what happens when the output voltage is increased to the 2.83vRMS speaker sensitivity test. I did measure with the EQ in-line but there was no meaningful difference so I won’t bother sharing the results.
/Bose%20901%20Series%20V%20(No%20EQ)_Impedance_0.1v_&_2.83v.png)
/Bose%20901%20Series%20V%20(No%20EQ)_FR_vs_Impedance_2.83v.png)
From the above data we can see the following:
- The tuning frequency is in the low 30’s.
- Lots of little resonances; namely the minor dip at 650Hz followed by the peak/dip at ~1kHz. Then another around 2.5kHz.
- Yes, the scale of the Phase is crazy; that’s a real measurement and I don’t know what’s going on to cause such a wild shift here. So I am leaving it.
Frequency Response
Notes about measurements (click for info)
The measurement below provides the frequency response at the reference measurement axis - also known as the 0-degree axis or “on axis” plane - in this measurement condition was situated at the ribbon.
/Bose%20901%20Series%20V%20(No%20EQ)%20FR_Linearity.png)
The mean SPL without EQ in-line is approximately 81dB at 2.83v/1m, calculated over the frequency range of 300Hz to 3,000Hz.
The blue shaded area represents the ±3dB response window from my calculated mean SPL value. As you can see in the blue window above, the Bose 901 Series V sans EQ has a ±3dB response from 62Hz - 20kHz. The ±1.5dB window is even worse. But, it’s a single 4.5” woofer with an off-shaped (by modern standards) baffle. Not making excuses. Just saying.
Now let’s look at a couple other measurements with the EQ in-line. Again, the title tells the EQ setup.
/Bose%20901%20Series%20V%20(Bass%202%20-%20EQs%20Neutral)%20FR_Linearity.png)
/Bose%20901%20Series%20V%20(Bass%202%20-%20Treble%20Min,%20Midbass%20Flat)%20FR_Linearity.png)
Below are both the horizontal and vertical response over a limited window (90° horizontal, ±40° vertical). I have provided a “normalized” set of data as well. The normalization simply means that I took the difference of the on-axis response and compared the other axes’ measurements to the on-axis response which gives the viewer a good idea of the speaker performance, relative to the on-axis response, as you move off-axis.
/Bose%20901%20Series%20V%20(No%20EQ)%20Horizontal%20FR.png)
/Bose%20901%20Series%20V%20(No%20EQ)_Horizontal_FR_Normalized.png)
/Bose%20901%20Series%20V%20(No%20EQ)%20Vertical%20FR.png)
/Bose%20901%20Series%20V%20(No%20EQ)%20Vertical%20FR%20Normalized.png)
As I said above, the provided frequency response graphs were given with a limited set of data. I measured the response of the speaker’s vertical and horizontal axis in 10-degree steps over 360-degrees. Nearly 70 measurements in total are represented in my data. As you can imagine, providing all those data points in a single FR-type graphic below is a bit overwhelming and confusing for the viewer. A spectrogram is an alternate way to view this full set of data. This takes a 360-degree set of data and “collapses” it down to a rectangular representation of the various angles’ SPL. I have provided two sets of data: one set for horizontal and one for vertical. Each set consists of 2 graphics:
- Full response (20Hz - 20kHz with the angles from 0° to ±180°) with absolute SPL values
- Full, “normalized” response (20Hz - 20kHz with the angles from 0° to ±180°) with SPL values relative to the 0-degree axis
/Bose%20901%20Series%20V%20(No%20EQ)_Horizontal_Spectrogram_Full.png)
/Bose%20901%20Series%20V%20(No%20EQ)_Horizontal_Spectrogram__Norm_Full.png)
/Bose%20901%20Series%20V%20(No%20EQ)_Vertical_Spectrogram_Full.png)
/Bose%20901%20Series%20V%20(No%20EQ)_Vertical_Spectrogram_Norm_Full.png)
The above spectrograms are the standard way of providing directivity graphics by most reviewers. Some prefer not to normalize the data. Some prefer to normalize the data. Either way, it’s a useful visual to get an idea of the directivity characteristics of a speaker or driver.
However, these “collapsed” representations of the sound field are not very intuitively viewed. At least not to me. So, I came up with a different way to view the speaker’s horizontal and vertical sound field by providing it across a 360° range in a globe plot below. I have provided both an absolute SPL version as well as a normalized version of both the horizontal and vertical sound fields.
Note the legend provided in the top left of each image which helps you understand speaker orientation provided in my global plots below.
/Bose%20901%20Series%20V%20(No%20EQ)_360_Horizontal_Polar.png)
/Bose%20901%20Series%20V%20(No%20EQ)_360_Horizontal_Polar_Normalized.png)
/Bose%20901%20Series%20V%20(No%20EQ)_360_Vertical_Polar.png)
/Bose%20901%20Series%20V%20(No%20EQ)_360_Vertical_Polar_Normalized.png)
Now let’s look at a couple other measurements with the EQ in-line. Again, the title tells the EQ setup.
This is with the EQ in-line but set to neutral (middle detent).
/Bose%20901%20Series%20V%20(Bass%202%20-%20EQs%20Neutral)_Horizontal_Spectrogram_Full.png)
/Bose%20901%20Series%20V%20(Bass%202%20-%20EQs%20Neutral)_Vertical_Spectrogram_Full.png)
/Bose%20901%20Series%20V%20(Bass%202%20-%20EQs%20Neutral)_360_Horizontal_Polar.png)
/Bose%20901%20Series%20V%20(Bass%202%20-%20EQs%20Neutral)_360_Vertical_Polar.png)
This is with the EQ in-line with the MidBass set to Neutral and the MidTreble set to max.
/Bose%20901%20Series%20V%20(Bass%202%20-%20Treble%20Min,%20Midbass%20Flat)_Horizontal_Spectrogram_Full.png)
/Bose%20901%20Series%20V%20(Bass%202%20-%20Treble%20Min,%20Midbass%20Flat)_Vertical_Spectrogram_Full.png)
/Bose%20901%20Series%20V%20(Bass%202%20-%20Treble%20Min,%20Midbass%20Flat)_360_Horizontal_Polar.png)
/Bose%20901%20Series%20V%20(Bass%202%20-%20Treble%20Min,%20Midbass%20Flat)_360_Vertical_Polar.png)
Bottom line here is the majority of this speaker’s sound is radiated toward the back. Not a real surprise. But very interesting to see how a speaker like this looks in this graphical format.
Last edited:

/Bose%20901%20Series%20V%20(No%20EQ)_SPIN.png)
/Bose%20901%20Series%20V%20(No%20EQ)_Early_Reflections_Breakout.png)
/Bose%20901%20Series%20V%20(No%20EQ)_Predicted_vs_Target.png)
/Bose%20901%20Series%20V%20(Bass%202%20-%20EQs%20Neutral)_SPIN.png)
/Bose%20901%20Series%20V%20(Bass%202%20-%20EQs%20Neutral)_Early_Reflections_Breakout.png)
/Bose%20901%20Series%20V%20(Bass%202%20-%20EQs%20Neutral)_Predicted_vs_Target.png)
/Bose%20901%20Series%20V%20(Bass%202%20-%20Treble%20Min,%20Midbass%20Flat)_SPIN.png)
/Bose%20901%20Series%20V%20(Bass%202%20-%20Treble%20Min,%20Midbass%20Flat)_Early_Reflections_Breakout.png)
/Bose%20901%20Series%20V%20(Bass%202%20-%20Treble%20Min,%20Midbass%20Flat)_Predicted_vs_Target.png)
/Bose%20901%20Series%20V%20(No%20EQ)_harmonicDistortion_linear.png)
/Bose%20901%20Series%20V%20(No%20EQ)_harmonicDistortion_linear_zoom.png)
/Bose%20901%20Series%20V%20(No%20EQ)_Compression_Normalized.png)
/Bose%20901%20Series%20V%20(Bass%202%20-%20EQs%20Neutral)_harmonicDistortion_linear.png)
/Bose%20901%20Series%20V%20(Bass%202%20-%20EQs%20Neutral)_harmonicDistortion_linear_zoom.png)
/Bose%20901%20Series%20V%20(Bass%202%20-%20EQs%20Neutral)_Compression_Normalized.png)
/maxspl_table_20.png)
/Bose%20901%20Series%20V%20(No%20EQ)_MTON_Compression%2020.png)
/Bose%20901%20Series%20V%20(No%20EQ)_MTON_Distortion%2020.png)
/maxspl_table_80.png)
/Bose%20901%20Series%20V%20(No%20EQ)_MTON_Compression%2080.png)
/Bose%20901%20Series%20V%20(No%20EQ)_MTON_Distortion%2080.png)
/Bose%20901%20Series%20V%20(No%20EQ)%20Nearfield.png)
/Bose%20901%20Series%20V%20Raw%20Step%20response.png)
/Bose%20901%20Series%20V%20Step%20Response%20Annotated.png)
