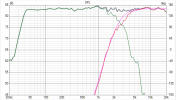
Didn't say final. I said filter design. Its open source, so waiting to see what it is at all? What we see is the summed response of two drivers with DSP, but what EQs and Xover slopes have been used to get here?
I mean with a score of 6.0 i doubt a traditional 2-way speaker can go any higher than that.
Yep, the Purifi driver makes the speaker an expensive DIY project.
However, the performance in terms of harmonic distortion (HD), intermodulation distortion (IMD) and displacement volume (DV, i.e. possible achievable sound pressure level in the low bass range) of the Purifi driver are exceptionally good.
With another woofer from SBAcoustics, for example, one could achieve a similar result at a much lower price, with a few sacrifices in HD, IMD and DV.
When you look at the measurements like this, it's almost boring.
On the other hand, we have a tiny speaker that, according to Amir's measurement, achieves an f3 of around 40Hz ( without DSP expansion) and can also produce reasonably low bass sound pressure levels due to the Xmax of +-10mm.
View attachment 157094
A cheap 6 or 6.5'' driver has a typical Xmax of about +-5mm. The displacement volume of the Purifi driver therefore corresponds to that of about two inexpensive 6.5'' drivers.
The quality of the drivers used is also reflected in the DSP settings. Very few corrections have to be made to achieve a good result.
View attachment 157087
As Amir said, the increased harmonic distortion around 400Hz was caused by the measurement setup.
In this frequency range, the Purifi driver and the passive resonator show no abnormalities.
The slightly increased HD3 (see 1. in the graph) around 9kHz and HD2 (see 2.) around 13.5kHz is due to theviolent(damned translation programs) breakup of the tweeter around 27kHz.
View attachment 157096
In Amir's measurement the 27kHz break-up is just visible due to the lowpass filter of the measurement system. In reality, this is much more pronounced and the cause of the (inaudible) increased HD values.
Manufacturer measurement of the Seas-DXT tweeter with break-up resonance at 27kHz:
View attachment 157098
For those interested, I have attached the complete VCAD project that corresponds to the version of Directiva measured by Amir.
the 'directivity mismatch' doesn't appear as severe in your data set, is it just different axis limits on the graphs or 'because' of the uber high resolution of the NFS?
