- Joined
- Nov 6, 2018
- Messages
- 1,449
- Likes
- 4,818
Hi Everyone,
Oh, wow, we are really spoiled here with the information and contributor quality!
Thx for sharing.

Hi Everyone,
Hi Everyone,
I sent this to MZKM yesterday but just noticed this thread today. Please see attached. You can skip everything and jump to the last equation showing the formula for calculating EPDR from impedance magnitude and impedance phase magnitude.
Just a note of caution that the EPDR derivation is based on a class-B output stage so it's valid for typical class-AB amps but certainly not for class-A and probably has only marginal relevance for class-D amps (would love to hear from a class-D expert on this topic).
For your background, the Benjamin Eric paper includes a thorough analysis of how to relate the speaker load to the amplifier dissipation but it's actually Keith Howard himself who invented EPDR as a cleaner way to present the data. I don't think that Keith has ever published the final calculation so when I came to want to do this myself I had to re-do the derivation and check with Keith that it matched his calculation.
The PDF is from my raw notes and was never intended for publication. It's a bit rough but seems like there's enough interest to justify me posting in this form.
Kind regards,
Jack.
=impedance*((1-sin(PI()*5/6))*sin(PI()*5/6))/((1-sin(PI()*5/6+abs(Radians(phase angle))*2/3))*sin(PI()*5/6-abs(Radians(phase angle))/3))
Hi Everyone,
I sent this to MZKM yesterday but just noticed this thread today. Please see attached. You can skip everything and jump to the last equation showing the formula for calculating EPDR from impedance magnitude and impedance phase magnitude.
Just a note of caution that the EPDR derivation is based on a class-B output stage so it's valid for typical class-AB amps but certainly not for class-A and probably has only marginal relevance for class-D amps (would love to hear from a class-D expert on this topic).
For your background, the Benjamin Eric paper includes a thorough analysis of how to relate the speaker load to the amplifier dissipation but it's actually Keith Howard himself who invented EPDR as a cleaner way to present the data. I don't think that Keith has ever published the final calculation so when I came to want to do this myself I had to re-do the derivation and check with Keith that it matched his calculation.
The PDF is from my raw notes and was never intended for publication. It's a bit rough but seems like there's enough interest to justify me posting in this form.
Kind regards,
Jack.
I checked it against what John Atkinson reports for Stereophile, so the EPDR calculation from the paper is correct. But whether the paper is correct, *shrug*.I can't view the original EPDR paper since it is paywalled, but I'm hesitant to point out that the PDF posted here does not pass a check on the EPDR values it gives. I don't want to seem unappreciative, but something is wrong. To check whether your EPDR value is correct you use that value resistor as the load of an ideal class B output stage. If you calculated EPDR correctly then your class B output stage will dissipate the same amount of power that it did when driving the speaker load.
When you do this in simulation you find that it gives too low values, and the sharp peaks are not accurate either.
In simulation you can find the EPDR value experimentally and the resulting curve does not have angular peaks and it doesn't drop as low. All the trigonometry and calculus is not required either, there is a much more common sense and accessible way to derive class B dissipation and EPDR.
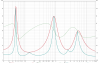
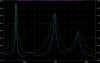
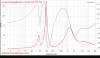
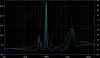
Attached is a REW measurement of EPDR and the same thing replicated in LTspice. The charts are size matched so you can open them in tabs and flip between them to compare. There are some differences since the simulation model does not perfectly replicate the real measured dummy load, but it is close enough to demonstrate the issues.
First picture is pma's dummy load measured with REW showing the EPDR curve. Second picture is the LTspice simulation where the Cyan trace is the same EPDR function REW uses and is provided in the PDF a page back. Magenta is my EPDR function which matches the experimentally determined EPDR curve I generate with an ideal class B circuit in LTspice.
I checked it against what John Atkinson reports for Stereophile, so the EPDR calculation from the paper is correct. But whether the paper is correct, *shrug*.
I thought 45-degrees is 2x the dissipation, but to get 1/2 impedance with the EPDR formula the angle only has to be ~27.5-degrees.
Also, you mentioned that this isn’t valid for Class-D, is there any known formula or even simply a trend as to how Class-D amps handle phase angles?I messaged Keantoken earlier today to understand his calculation more clearly. The difference is that his calculation is based on the average dissipation power. So you can think of it as Equivalent Average Dissipation Resistance (EADR). This is a useful measure because it would help understand how hot the amp will get. The Equivalent Peak Dissipation Resistance (EPDR) instead looks at the maximum instantaneous power dissipation and this is more relevant if you want to consider the SOA of the output devices, or if the amp protection might be triggered. Both are potentially useful measures. In the pdf I provided there's an expression for the average dissipated power and, if there is interest, I can derive an expression for EADR from this.
It would be nice if Amir also measured wattage into 2ohm, but I assume he would be fearful of damaging an amp.It would be nice to have this additional measurement. However, it would also be nice to see how amplifiers behave at extremely low impedance. Is there a trend by type of amplifier such as Class D vs Class AB, or even across the different popular Class D modules?
Very few amplifiers have a 2 ohm rating. The inexpensive Crown XLS series does.It would be nice if Amir also measured wattage into 2ohm, but I assume he would be fearful of damaging an amp.
I'm pretty sure the LS50 does that. Stereophile has been "eyeballing" that data for years.Right, but that may be taking into account real loads. The EPDR shows that many speakers go to 2phm <200Hz.
well, that's interesting.Also, you mentioned that this isn’t valid for Class-D
Also, you mentioned that this isn’t valid for Class-D, is there any known formula or even simply a trend as to how Class-D amps handle phase angles?
Nothing that I'm aware of. I believe that the behaviour will be totally different in a class-D. Would be great to hear from a class-D expert on this topic.
In addition to that, I would need a new dummy load and wiring to handle such power.It would be nice if Amir also measured wattage into 2ohm, but I assume he would be fearful of damaging an amp.