Hi,
The most interesting result is this one :
It represents the correct balloon plot, but about
5 cm away from the speaker, not 2 meters.
And no it is not upside down. Since the reference point is taken below the tweeter. The measured sound in this point comes from above, thus, fires downwards.
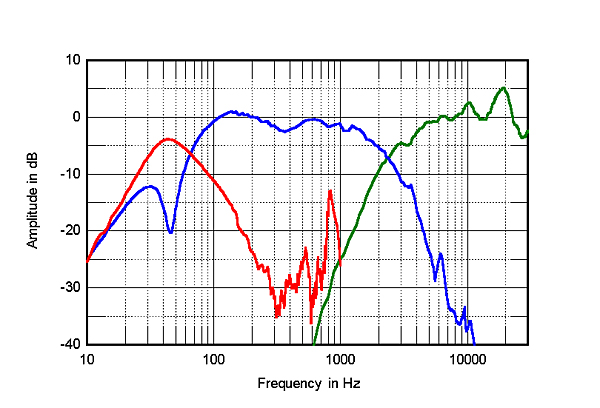
The drop in high frequencies is consistent with the angle of the balloon plot : about -5 dB at 10 kz, which is what is expected about 35 or 40° from the axis, according to the other graph :
But... it is only consistent above 7000 Hz. As if the internal routines were using two different methods to calculate the frequency response above and below 7000 Hz.
Another possibility is a problem with microphone calibration. The frequency and amplitude anomaly is consistent with an uncalibrated microphone.
About the dip in low frequencies, it has been said above that the Klippel system should be more accurate than the others. However, let's not forget that low frequencies have large wavelength. Scanning two close surfaces, it should still be very difficult to separate direct sound from the first reflections.
In fact, below 100 Hz, we use to say that there is no such thing as a direct sound and a reflection. The whole wave is generated by the speaker and the walls at the same time.
True free field measurement will be the judge, if one day we can do it. Ground plane, in principle, should be a good reference too, but we are talking about 1 - 2 dB variations here. Is ground plane measurement accurate enough ?

 Is it too hard to ask to you to be polite and constructive?