• WANTED: Happy members who like to discuss audio and other topics related to our interest. Desire to learn and share knowledge of science required. There are many reviews of audio hardware and expert members to help answer your questions. Click here to have your audio equipment measured for free!

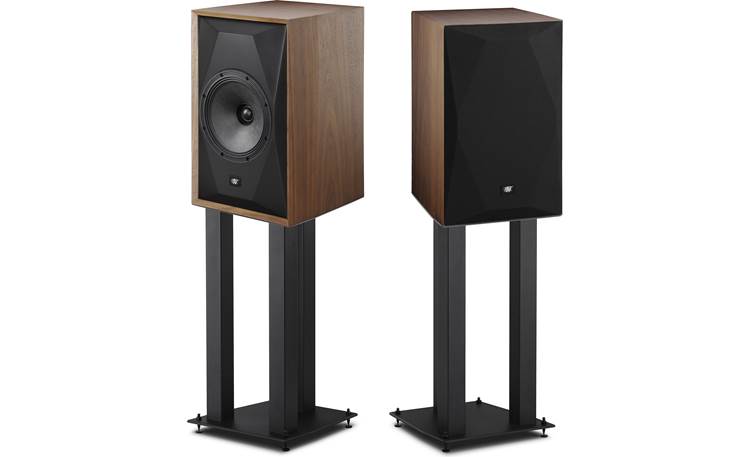
MoFi Sourcepoint 8 measured by ErinsAudioCorner

daverosenthal

Member
Forum Donor
Joined
Jan 5, 2020
Messages
40
Likes
104

Looks like very solid performance with well controlled dispersion, leading to a nice flat modeled in-room response with a pleasant 5-7 dB downwards tilt. A bit high distortion below 250hz, but good performance on the compression test.

All in all looks more tempting than the 10 to me.

Thoughts?
 
Last edited:

YSC

Major Contributor
Joined
Dec 31, 2019
Messages
3,208
Likes
2,609

Looks like very solid performance with well controlled dispersion, leading to a nice flat modeled in-room response with a pleasant 5-7 dB downwards tilt. A bit high distortion below 250hz, but good performance on the compression test.

All in all looks more tempting than the 10 to me.

Thoughts?
looks great, but somehow for the price I am wondering could we get something performing better and point source from KEF or Genelec?
 

restorer-john

Grand Contributor
Joined
Mar 1, 2018
Messages
12,728
Likes
38,939
Location
Gold Coast, Queensland, Australia
This plot is a bit of a strange one. What does it tell us that is useful?

1703061184546.png


The bottom plot is labeled 'noise floor'. Of what exactly, the room the Klippel is in? And if it is the location's noise floor, the Klippel certainly isn't removing it from the MD distortion plots.
 

thewas

Master Contributor
Forum Donor
Joined
Jan 15, 2020
Messages
6,903
Likes
16,927
All in all looks more tempting than the 10 to me.
Same for me, multitone distortion isn't much worse but tuning is better (which could be corrected by EQ) but also directivity seems a tad smoother (which cannot)..
 

Steve Dallas

Major Contributor
Joined
May 28, 2020
Messages
1,217
Likes
2,926
Location
A Whole Other Country
This plot is a bit of a strange one. What does it tell us that is useful?

View attachment 335675

The bottom plot is labeled 'noise floor'. Of what exactly, the room the Klippel is in? And if it is the location's noise floor, the Klippel certainly isn't removing it from the MD distortion plots.

It tells us how much distortion would be reduced if crossing to a sub at 80Hz.
 
OP
D

daverosenthal

Member
Forum Donor
Joined
Jan 5, 2020
Messages
40
Likes
104
The bottom plot is labeled 'noise floor'. Of what exactly, the room the Klippel is in? And if it is the location's noise floor, the Klippel certainly isn't removing it from the MD distortion plots.
Yes, it's showing the signal and noise of the measurement. The noise in this case is microphone noise/room noise. The signal is the unwanted distortion products. Seeing the noise floor is 30dB+ below the signal in question just goes to validate that we are getting a very good measure of them. Erin could equally well just leave the noise floor off the graph and ensure us that the measurement was done in a valid way.
 
OP
D

daverosenthal

Member
Forum Donor
Joined
Jan 5, 2020
Messages
40
Likes
104
looks great, but somehow for the price I am wondering could we get something performing better and point source from KEF or Genelec?
I took a careful look at the (comparably priced) KEF R3 Meta's measurements vs this speaker and one is not an obvious winner. Here's how they trade blows:
  • Frequency response smoothness: Slight win to the KEF (some minor wrinkles up at 5kHz in the Sourcepoint)
  • Bass extension: Win to Sourcepoint (KEF starts a gradual roll off at 90Hz)
  • Dispersion: Tie. Both very good. KEF gets generally narrow in the upper treble but Sourcepoint starts beaming at 15+kHz.
  • Distortion: Kef wins (better controlled in the 60-200hz range, though MT distortion looks a bit better on Sourcepoint...)
  • Compression/dynamics: Sourcepoint wins
Given how highly regarded the R3 is, the Sourcepoint made a really good showing.
 

staticV3

Master Contributor
Joined
Aug 29, 2019
Messages
8,014
Likes
12,858
This plot is a bit of a strange one. What does it tell us that is useful?
Erin made a video about multitone distortion and his methodology: https://youtu.be/i1sa50hzEcM

The bottom plot is labeled 'noise floor'. Of what exactly, the room the Klippel is in?
Correct.

And if it is the location's noise floor, the Klippel certainly isn't removing it from the MD distortion plots.
The Klippel's entire shtick is that it removes room reflections. Not noise.
 

MattHooper

Master Contributor
Forum Donor
Joined
Jan 27, 2019
Messages
7,332
Likes
12,294
Interesting. Seems there's been a fair amount of love for the SP8. I'd like to hear it.

When the Mo-Fi speakers were introduced there was some ASR cynicism aimed toward it: another passive speaker, designed by an audiophile celebrity, will probably be praised but measure lacklustre.

Seems Andrew Jones does have a clue about what he's doing.
 

restorer-john

Grand Contributor
Joined
Mar 1, 2018
Messages
12,728
Likes
38,939
Location
Gold Coast, Queensland, Australia
The Klippel's entire shtick is that it removes room reflections. Not noise.

Their schtick aside, let's start again.

The MD (multitone) plots show a noise floor. The noise floor is apparently the supposed acoustic noisefloor of the location the klippel is in. It has spikes and troughs (and a pretty poor resolution if you ask me). If it's not actually measured, it's computed (poorly). Why then are we seeing an 'acoustic' noisefloor rising ~30dB up to 20kHz? That is clearly not any normal noisefloor is it? Not even in a water jet cutting plant.

Why are we seeing THD spikes and troughs exactly where there are acoustic noise floor spikes and troughs? The measurement is either THD (MD) or THD with Noise. And, if it's THD with Noise (THD+N) the plots are useless aren't they? Can't have it both ways.

Here's Erin's plot (the bottom one) from the video you linked:
1703125544912.png


And this one of the sourcepoint:
1703125793744.png

Look at the rise in the 'noise floor' and the way it manifests into the distortion plots. It's just not even close to a typical or even an atypical acoustic noisefloor which slopes the complete opposite direction.
 
OP
D

daverosenthal

Member
Forum Donor
Joined
Jan 5, 2020
Messages
40
Likes
104
The MD (multitone) plots show a noise floor. The noise floor is apparently the supposed acoustic noisefloor of the location the klippel is in. It has spikes and troughs (and a pretty poor resolution if you ask me). If it's not actually measured, it's computed (poorly). Why then are we seeing an 'acoustic' noisefloor rising ~30dB up to 20kHz? That is clearly not any normal noisefloor is it? Not even in a water jet cutting plant.

Why are we seeing THD spikes and troughs exactly where there are acoustic noise floor spikes and troughs? The measurement is either THD (MD) or THD with Noise. And, if it's THD with Noise (THD+N) the plots are useless aren't they? Can't have it both ways.

And this one of the sourcepoint:
View attachment 335877
Look at the rise in the 'noise floor' and the way it manifests into the distortion plots. It's just not even close to a typical or even an atypical acoustic noisefloor which slopes the complete opposite direction.

The answer is that the noise floor is a calculation of the noise intrinsic in the post-processed measurement, not of the room itself. In other words, it's been through a bunch of math.

*** Update: Maybe not a bunch of math :) Amir says below that the Klippel test here is likely just subtracting the distortion and noise measurements from a shaped fundamental signal, which is leading to the effects seen (rising HF noise floor and correlation between distortion and noise). The example below explains an analogous behavior when using a shaped signal to measure speaker impulse. ***

Let me give you an example. I wrote some code to extract the frequency response of a fake speaker. I simulated using a microphone with some intrinsic white noise to record a log frequency sweep of a virtual speaker (the speaker having some simulated wonky HF response I threw in). The code then uses deconvolution techniques to extract the impulse response of that speaker. (This being the standard approach.) The code also uses similar math on the noise signal to compute a post-processed noise floor. The extracted speaker frequency response can be seen in orange, the computed noise floor in blue. Note that the computed noise floor is rising in high frequencies even though the simulated microphone's simulated noise floor did not!

In this case the orange signal is well clear (10s of dBs) of the noise floor, and indeed the extracted speaker response is basically a perfect measure (of my imperfect simulated speaker). This is why the noise floor is shown--the basic idea is that if you're well clear of it you're getting a good measurement.

1703137556921.png


OK, I now simulated raising the noise floor quite a lot. You can see that the extracted speaker response curve in orange is now close to the noise floor and is indeed being affected by it. This is an example of a bad measurement.
1703137903638.png


I haven't shown the answer to the part of your question that asks why the computed measurement noise floor in the Klippel system seems to have some correlation with the signal. That's an interesting question, but I the answer is almost surely that it's just an artifact of the complex processing math. Assuming the engineers at Klippel know what they are doing, we should be able to look at that computed noise floor, see it's 30dB+ away from the signal, and be assured that we're actually looking at a reasonable measure of actual distortion, not just noise.
 
Last edited:

amirm

Founder/Admin
Staff Member
CFO (Chief Fun Officer)
Joined
Feb 13, 2016
Messages
44,680
Likes
241,174
Location
Seattle Area
Look at the rise in the 'noise floor' and the way it manifests into the distortion plots. It's just not even close to a typical or even an atypical acoustic noisefloor which slopes the complete opposite direction.
That's because a) he has labeled it wrong and b) he is not showing the actual multitone signal level.

The proper label is relative noise floor to the multitone signal. The multitone signal is likely shaped with reducing high frequency spectrum. As a result, constant room noise will show as rising level since the speaker output is lower there when shown as a ratio. If he had shown the actual spectrum of multitone signal, we would have been able to see this. This is also why the noise floor seems modulated by speaker output. That happens because again, it is a relative level, not absolute.
 

amirm

Founder/Admin
Staff Member
CFO (Chief Fun Officer)
Joined
Feb 13, 2016
Messages
44,680
Likes
241,174
Location
Seattle Area
The answer is that the noise floor is a calculation of the noise intrinsic in the post-processed measurement, not of the room itself.
It is not post processed. Klippel simply measures the room first without signal to capture the ambient noise.
 
OP
D

daverosenthal

Member
Forum Donor
Joined
Jan 5, 2020
Messages
40
Likes
104
That's because a) he has labeled it wrong and b) he is not showing the actual multitone signal level.

The proper label is relative noise floor to the multitone signal. The multitone signal is likely shaped with reducing high frequency spectrum. As a result, constant room noise will show as rising level since the speaker output is lower there when shown as a ratio. If he had shown the actual spectrum of multitone signal, we would have been able to see this. This is also why the noise floor seems modulated by speaker output. That happens because again, it is a relative level, not absolute.
It is not post processed. Klippel simply measures the room first without signal to capture the ambient noise.
Cool. I think we're saying the same thing. That is, the line labeled as "noise floor" in the graph is the result of a computation, it's not just a spectrum of the raw microphone/room noise. I'm using the words "post processed", though it sounds like maybe the only thing that's happening is a simple subtraction from a shaped multi-tone signal.
 

geox

Member
Joined
May 30, 2022
Messages
41
Likes
57
I took a careful look at the (comparably priced) KEF R3 Meta's measurements vs this speaker and one is not an obvious winner. Here's how they trade blows:
  • Frequency response smoothness: Slight win to the KEF (some minor wrinkles up at 5kHz in the Sourcepoint)
  • Bass extension: Win to Sourcepoint (KEF starts a gradual roll off at 90Hz)
  • Dispersion: Tie. Both very good. KEF gets generally narrow in the upper treble but Sourcepoint starts beaming at 15+kHz.
  • Distortion: Kef wins (better controlled in the 60-200hz range, though MT distortion looks a bit better on Sourcepoint...)
  • Compression/dynamics: Sourcepoint wins
Given how highly regarded the R3 is, the Sourcepoint made a really good showing.

Sourcepoint 8 is 1.6 times more expensive than Kef R3 meta
 

Ninjastar

Member
Joined
Oct 13, 2021
Messages
73
Likes
221
Sourcepoint 8 is 1.6 times more expensive than Kef R3 meta
Not quite.

The Sourcepoint 8 retails for $2750 (without stands) and the R3 Meta is $2199.99.

The MoFi are on sale now through May for $1999 (without stands) so actually cheaper than the R3 Meta currently.


restorer-john

Grand Contributor
Joined
Mar 1, 2018
Messages
12,728
Likes
38,939
Location
Gold Coast, Queensland, Australia
Not quite.

The Sourcepoint 8 retails for $2750 (without stands) and the R3 Meta is $2199.99.

The MoFi are on sale now through May for $1999 (without stands) so actually cheaper than the R3 Meta currently.


Looks like a decent deal if you could get the stands thrown in as well.
 
Top Bottom