Ouch - that would rule it out for my use case of "the odd sum a few times a year"But the home license costs USD$195/yr.


Ouch - that would rule it out for my use case of "the odd sum a few times a year"But the home license costs USD$195/yr.
Great post. I would add that the curve tracing and modeling can also all be done using VituixCad, which is free.The frequency response of the Wiim Amp can be almost entirely predicted as a response of the LC output filter. So there isn't any big mystery as to how the Wiim Amp responds to "complex loads" (i.e. the response is highly predictable when the speaker impedance is known).
The L and C values from TI's Class D Amplifier LC Filter Design application note example works perfectly.
View attachment 352542
The filter L is: 11.25 μH
The filter C is: 2 * C_btl = 2 * 0.68 μF = 1.38 μF
R_load = R_btl/2 = R_speaker/2
The complex impedance of an inductor: Z_l = 1j * ω * L
The complex impedance of a capacitor: Z_c = -1j / (ω * C)
Using the voltage divider formula, the frequency response is given as:
View attachment 352558
The magnitude and phase of Z_spkr ( | Z_spkr | and angle( Z_spk r) ) are read from the impedance curve with help from WebPlotDigitizer and interpolated for the calculations.
Below are the plots of the digitized impedance magnitude and phase of Erin's "complex load":
View attachment 352553View attachment 352554
Here is the calculated frequency (magnitude) response, and it well matched Erin's measurement.
View attachment 352555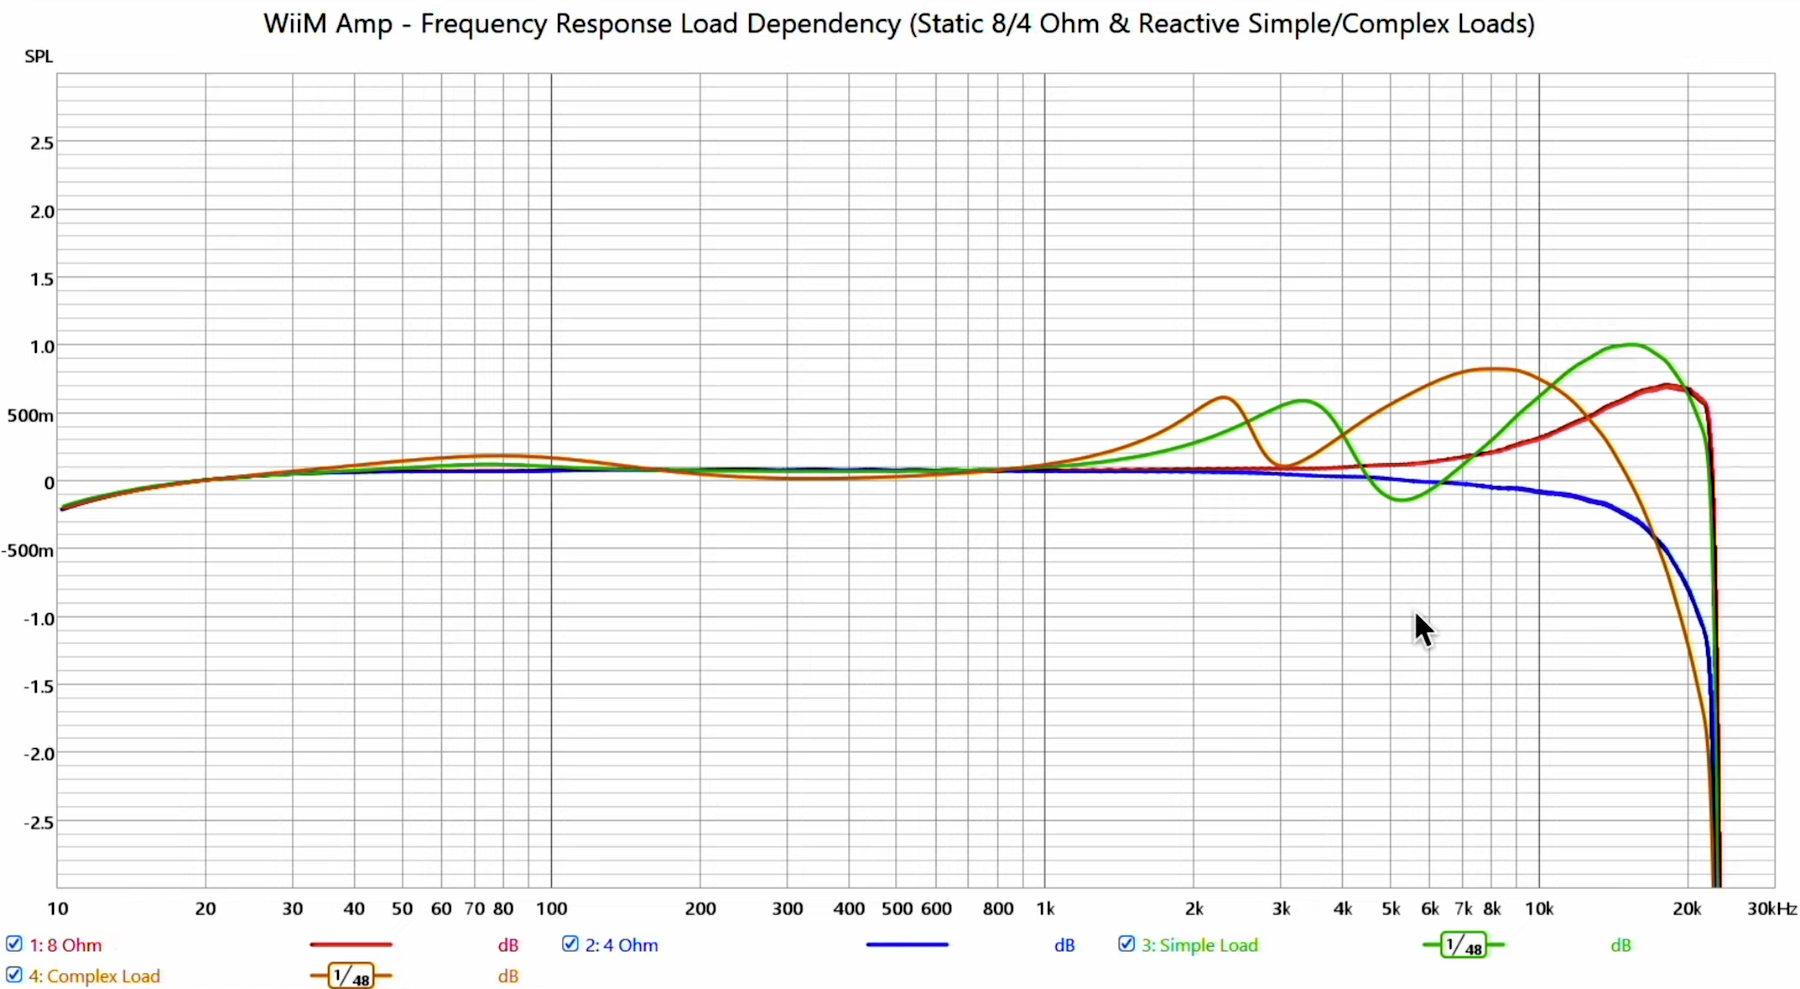
The frequency response of the Wiim Amp can be almost entirely predicted as a response of the LC output filter.
The L and C values from TI's Class D Amplifier LC Filter Design application note example works perfectly.
It's free for non-commercial use on a Pi. https://www.wolfram.com/raspberry-pi/Ouch - that would rule it out for my use case of "the odd sum a few times a year"
Note that you don't really need to know the implementation of the circuit; you just need to measure the amplifier's output impedance characteristic (magnitude and phase vs frequency) to be able to calculate its FR into any load.If I understand you correctly, this unfortunately means that it is not possible to predict the frequency response behavior of any amplifier under a complex load, since one typically does not know the Class-D circuit and LC filter design of the manufacturer?
I don't know anything about the design of the Wiim Amp output filter. For my calculations, I only used the values given in the TI App note I referenced in my earlier post, and they happened to match very well. My point is that the FR behavior is not caused by some mysterious complex interactions with the load that happened deep inside the class-d amp circuitry.Thanks @NTK for your efforts.
A few things are still not clear to me (sorry, I'm not an electronic expert), do I understand you correctly, in order to be able to carry out the simulation, you have to know which Class-D circuit and LC filter design the manufacturer of the Class-D amp used?
Because Erin provided the frequency response measurement of the amplifier with the complex load, were you able to decide which Class-D circuit and which LC filter design was used by the amp manufacturer?
If I understand you correctly, this unfortunately means that it is not possible to predict the frequency response behavior of any amplifier under a complex load, since one typically does not know the Class-D circuit and LC filter design of the manufacturer?
Below is the comparison of your simulation (dark blue) with Erin's frequency response measurement (brown/orange). The agreement is really good.
Are the deviations above 1kHz possibly due to the manufacturer using slightly different LC filter values?
How can it be explained that in the range of 20-200Hz, your simulation, unlike the measurement, shows no change in frequency response?
View attachment 354573
I don't know anything about the design of the Wiim Amp output filter. For my calculations, I only used the values given in the TI App note I referenced in my earlier post, and they happened to match very well. My point is that the FR behavior is not caused by some mysterious complex interactions with the load that happened deep inside the class-d amp circuitry.
One thing I should point out is that the corner frequency of the LC is given as: fc = 1/( 2π √(L×C) ). If there is a capacitive component in the load impedance, the capacitive part will act in parallel with the output filter C, and since that will increase the effective filter C, it pushes the filter corner frequency (and the resonance peak) lower, and that, IMHO, is the most significant cause of the frequency response fluctuation.
For the low frequencies, the output LC filter, being a high pass filter with a high fc, shouldn't matter much. Those response deviations are most likely due to different causes.
If you have time, can you make a prediction of a common speaker (like the Elac dbr62) and plot the result?The frequency response of the Wiim Amp can be almost entirely predicted as a response of the LC output filter. So there isn't any big mystery as to how the Wiim Amp responds to "complex loads" (i.e. the response is highly predictable when the speaker impedance is known).
The L and C values from TI's Class D Amplifier LC Filter Design application note example works perfectly.
View attachment 352542
The filter L is: 11.25 μH
The filter C is: 2 * C_btl = 2 * 0.68 μF = 1.38 μF
R_load = R_btl/2 = R_speaker/2
The complex impedance of an inductor: Z_l = 1j * ω * L
The complex impedance of a capacitor: Z_c = -1j / (ω * C)
Using the voltage divider formula, the frequency response is given as:
View attachment 352558
The magnitude and phase of Z_spkr ( | Z_spkr | and angle( Z_spk r) ) are read from the impedance curve with help from WebPlotDigitizer and interpolated for the calculations.
Below are the plots of the digitized impedance magnitude and phase of Erin's "complex load":
View attachment 352553View attachment 352554
Here is the calculated frequency (magnitude) response, and it well matched Erin's measurement.
View attachment 352555
All users of this amp have EQ. Not wanting it is just silly.. we can stop the objectively good sound discussion right there… and yes, you have to measure, you should do that anyway. Passive impedance correction you have to measure as well
Yes! You are correct…except think you meant the output LC is a low pass filter.
Interesting - though out of date since noobs is no longer offered. I'll have to check my latest raspi OS install.It's free for non-commercial use on a Pi. https://www.wolfram.com/raspberry-pi/
Image them implementing more than a handful of PEQsimagine wasting two filters to fix this amp being inadequate.
Then good luck finding an alternative product with similar features and price with a better amp..it's like saying buying a badly sounding headphone and then EQing it, except it's way easier to make an accurate amplifier than to make a good sounding headphone.
Image them implementing more than a handful of PEQs
Then good luck finding an alternative product with similar features and price with a better amp..
Note that you don't really need to know the implementation of the circuit; you just need to measure the amplifier's output impedance characteristic (magnitude and phase vs frequency) to be able to calculate its FR into any load.
This is why I'd personally love to see output impedance measurements in amplifier reviews...
The main rant about tube amps the last century apart from high THD+N (mostly inaudible with music,I have compared nice ones) was exactly that,load dependency and low power.
Are we going in circles?
For what?Price?
I don't think that's the way.
They don’t have the same feature set, especially not for € 350, nor compact format. But yes, an AVR quickly becomes an interesting proposition if you have a bit more budget and can spare the room.Like the plethora of AVRs out there with the same A/B amplifier modules for the last 20 years?
It happens that I had a little of free time todayIf you have time, can you make a prediction of a common speaker (like the Elac dbr62) and plot the result?
Yes. I saw your post in the Wiim Amp review thread. Your VCAD simulation results and mine for the JBL HDI-1600 matched very wellGreat post. I would add that the curve tracing and modeling can also all be done using VituixCad, which is free.
 www.audiosciencereview.com
Great post. I would add that the curve tracing and modeling can also all be done using VituixCad, which is free.


 ).
).