grogi.giant
Active Member
- Joined
- Apr 30, 2021
- Messages
- 258
- Likes
- 175
That's what I call Audio Science ")

This is true, but then it seems to be able to determine phase automaically just from knowing the magnitude curve. I don't know how that works but it seems pretty accurate.With the VCAD trace tool, you can only read the impedance frequency response. There is no way to read the impedance phase frequency response (AFAIK).
However, it seems that the impedance phase frequency response behaves almost as a minimal phase system, so the resulting phase error is relatively small.
Here is a comparison of the impedance phase frequency response of the measurement with the phase frequency response calculated by VCAD from the impedance measurement - see the orange arrows (please ignore the impedance curve, as the scaling is incorrect there).
View attachment 354587
If one is willing to accept slight impedance phase errors, the "SPL Trace" tool of VCAD can be used to read the impedance frequency response, and then the impedance + phase response can then be written into a file using the export function.
Thanks a lot for all the data provided by @NTK and you; I really appreciate it. It seems like speakers like dbr62 are pretty much “fine” with it, and even if you can hear any difference (and I honestly doubt it), you should be able to fix it with peq. Maybe just JBL 590 seems to lose a bit too much of HF (but I don’t think that many people are able to notice a difference in that region). BTW, yesterday evening I’ve decided to buy it from Amazon and today I’m going to try it out. I’m going to try it with the DBR62; I’m really curious to see how it compares to my class ab. I don’t have any calibrated mics, unfortunately, but I’m going to measure with rew and my iPhone as mic just to take a look at the delta in the high frequencies to see if it is close to the predicted one.So, I've adopted @NTK's idea about the low-pass filter of Class-D amplifier and simulated it in VCAD. This means that a passive filter was designed to closely match the frequency response for Erin's measurements of the Wiim-Amp with a complex load and a constant 8-ohm load.
Here's the effect of the filter with an 8-ohm load (orange measurement, red simulation):
View attachment 354619
Here's the effect of the filter with Erin's complex load (orange measurement, red simulation):
View attachment 354620
The filter used accurately reflects the load dependency of the WiimAmp (above 200Hz). This makes it easy to determine the approximate frequency response for any speaker loads - similar to what @NTK does, but without requiring Mathematica software, only VCAD.
The reason the simulation does not match in the low-frequency range below 200Hz is that the high-pass behavior (frequency response drop below 20Hz) of the amplifier is not simulated.
Here's the simulated frequency response of the WiimAmp when using ELAC DBR-62 speaker (accurate only above 200Hz):
View attachment 354621
Think that's close to NTK's simulation in post#118.
Here's the simulated frequency response WiimAmp using JBL Studio 590 speaker (accurate only above 200Hz):
View attachment 354622
Here's the simulated frequency response WiimAmp using JBL Studio 698 speaker (accurate only above 200Hz):
View attachment 354626
Here's the simulated frequency response WiimAmp using Wharfedale Aura 2 speaker (accurate only above 200Hz):
View attachment 354624
Attached you will find the VCAD project. With this, anyone can conduct simulations of speakers on the WiimAmp amplifier (provided my considerations for the simulation are correct
In the Driver tab of VCAD, simply select the speaker impedance you want to simulate. If you delete the impedance, VCAD defaults to a constant 8-ohm load.
View attachment 354628


Since simulating the frequency response of the WiimAmp with different speakers using VCAD simulation is easy and quick (thanks to NTK), I have conducted a few simulations of 2.5 and 3-way floorstand-speaker.
But keep in mind that
- these are simulations, and the high-pass behavior of the Class-D amplifier is only approximated.
- only the impedance frequency response was "scanned" and the impedance phase frequency response was calculated, assuming that the speaker impedance behaves like a minimal phase system.
- the simulation is only valid above 200Hz.
In all simulations, the frequency response of the amplifier with an 8-ohm constant load is plotted as a dashed blue line for comparison.
What surprises me is how much the frequency response of the amplifier differs when speakers are used as load compared to the standard 8-ohm constant load.
The first diagram always shows the frequency response simulation of the amplifier (red curve), the second diagram shows the impedance of the speaker (red curve).
Klipsch Forte IV
A fairly linear trend up to 10kHz with a 0.5dB peak at 5.4kHz. SPL increases by 1.5-1.8dB from 13kHz onward.
View attachment 354753 View attachment 354754
Focal Chora 816
A broad 0.7dB peak at 6.6kHz, otherwise unremarkable.
View attachment 354755 View attachment 354756
KEF R5 Meta
The frequency response increases from 3kHz, reaching 0.7dB at 10kHz (0.8dB at 18kHz).
View attachment 354757 View attachment 354758
TAD Evolution Two
The frequency response increases from 3kHz to 1.9dB at 10kHz with a peak of 2dB at 11kHz.
View attachment 354759 View attachment 354760
Attached you will find the "scanned" impedance of the speakers. With these, you can conduct the simulations in VCAD yourself - for more details, see post#120.
Thanks a lot for all the data provided by @NTK and you; I really appreciate it. It seems like speakers like dbr62 are pretty much “fine” with it, and even if you can hear any difference (and I honestly doubt it), you should be able to fix it with peq. Maybe just JBL 590 seems to lose a bit too much of HF (but I don’t think that many people are able to notice a difference in that region). BTW, yesterday evening I’ve decided to buy it from Amazon and today I’m going to try it out. I’m going to try it with the DBR62; I’m really curious to see how it compares to my class ab. I don’t have any calibrated mics, unfortunately, but I’m going to measure with rew and my iPhone as mic just to take a look at the delta in the high frequencies to see if it is close to the predicted one.
On MacBook you can select iPhone/iPad microphone if connected to the same WiFi network and then make the classic room measurement. It’s certainly not going to be accurate, specially in high frequency spectrum, but I think that the delta between the two measurements is going to be pretty accurateI don't see how you can use your iPhone as microphone for RAW...
But - just to compare two AMPS, you can use laptop built-in microphone.
On MacBook you can select iPhone/iPad microphone if connected to the same WiFi network and then make the classic room measurement. It’s certainly not going to be accurate, specially in high frequency spectrum, but I think that the delta between the two measurements is going to be pretty accurate


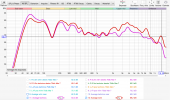
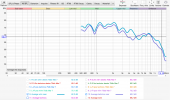
I've done my best, I made both a near-field measurement as you described and one from my listening position. Idk how accurate it can be, but it seems pretty different from what I've expectedIf you want to conduct comparative measurements, you should perform near-field measurements to minimize reflections in the measurement. Otherwise, simply the position of your body in the room can influence the measurement.
It's best to place the iPhone on a tripod or something similar (at the level of the tweeter, at a distance of 0.3m) and position your speaker as freely as possible (i.e., free from reflective surfaces, with tweeter at half the ceiling height) in the room.
The position of the speaker and the microphone must not change between measurements.
This way, it should be possible to obtain comparable measurements for different amplifiers.
I've done my best, I made both a near-field measurement as you described and one from my listening position. Idk how accurate it can be, but it seems pretty different from what I've expected
Yea, it looks pretty significant, and the difference is definitely noticeable. Btw, I don't know how accurate even the technics was because it was pretty old and had some problems here and there. At the moment, doing the measurements again with the technics would be pretty difficult, but I have many old measurements in the listening position that looks exactly the same. It would be nice to see someone doing the same, maybe with a calibrated mic to be sure of the result. Btw, damn, except for the fr this device it’s so great at its price point. Tomorrow, I'm going to try to play a little with peq and see what I can doThose are really significant differences
I can't tell you how accurate your measurements are either. If both amplifiers were in "direct source" mode during the measurement (meaning no EQ was active), then you can increase the reliability of your measurement by repeating it.
If the results are identical with the old ones, your measurement is reliable, or there is a systematic error.
I didn't catch which speaker you are using?
This is indicative of the issue with the high-power multitone: you have no idea what to conclude from it.