Copy/paste from my site. Review may not translate from my site so here is the link to the full review on my site:
https://www.erinsaudiocorner.com/loudspeakers/elac_ubr62/
ELAC UBR62 Speaker Review

Foreword / YouTube Video Review
The review on this website is a brief overview and summary of the objective performance of this speaker. It is not intended to be a deep dive. Moreso, this is information for those who prefer “just the facts” and prefer to have the data without the filler. Discussion about the data and my subjective thoughts can be found in my video below.
<<coming soon>>
For a primer on what the data means, please watch my series of videos where I provide in-depth discussion and examples of how to read the graphics presented hereon.
https://youtube.com/playlist?list=PLnIxFR_ey0b37Ex4KV2mBz-kYB7QLffR1
Information and Photos
The ELAC UBR62 is a 3-way bookshelf speaker featuring a 6.5-inch midwoofer, 4-inch concentric with 1-inch dome tweeter placed coaxially.
MSRP for a pair of the UBR62 speakers is currently $999 USD.

CTA-2034 (SPINORAMA) and Accompanying Data
All data collected using Klippel’s Near-Field Scanner. The Near-Field-Scanner 3D (NFS) offers a fully automated acoustic measurement of direct sound radiated from the source under test. The radiated sound is determined in any desired distance and angle in the 3D space outside the scanning surface. Directivity, sound power, SPL response and many more key figures are obtained for any kind of loudspeaker and audio system in near field applications (e.g. studio monitors, mobile devices) as well as far field applications (e.g. professional audio systems). Utilizing a minimum of measurement points, a comprehensive data set is generated containing the loudspeaker’s high resolution, free field sound radiation in the near and far field. For a detailed explanation of how the NFS works and the science behind it, please watch the below discussion with designer Christian Bellmann:
The reference plane in this test is at the tweeter.
Measurements are provided in a format in accordance with the Standard Method of Measurement for In-Home Loudspeakers (ANSI/CTA-2034-A R-2020). For more information, please see this link.
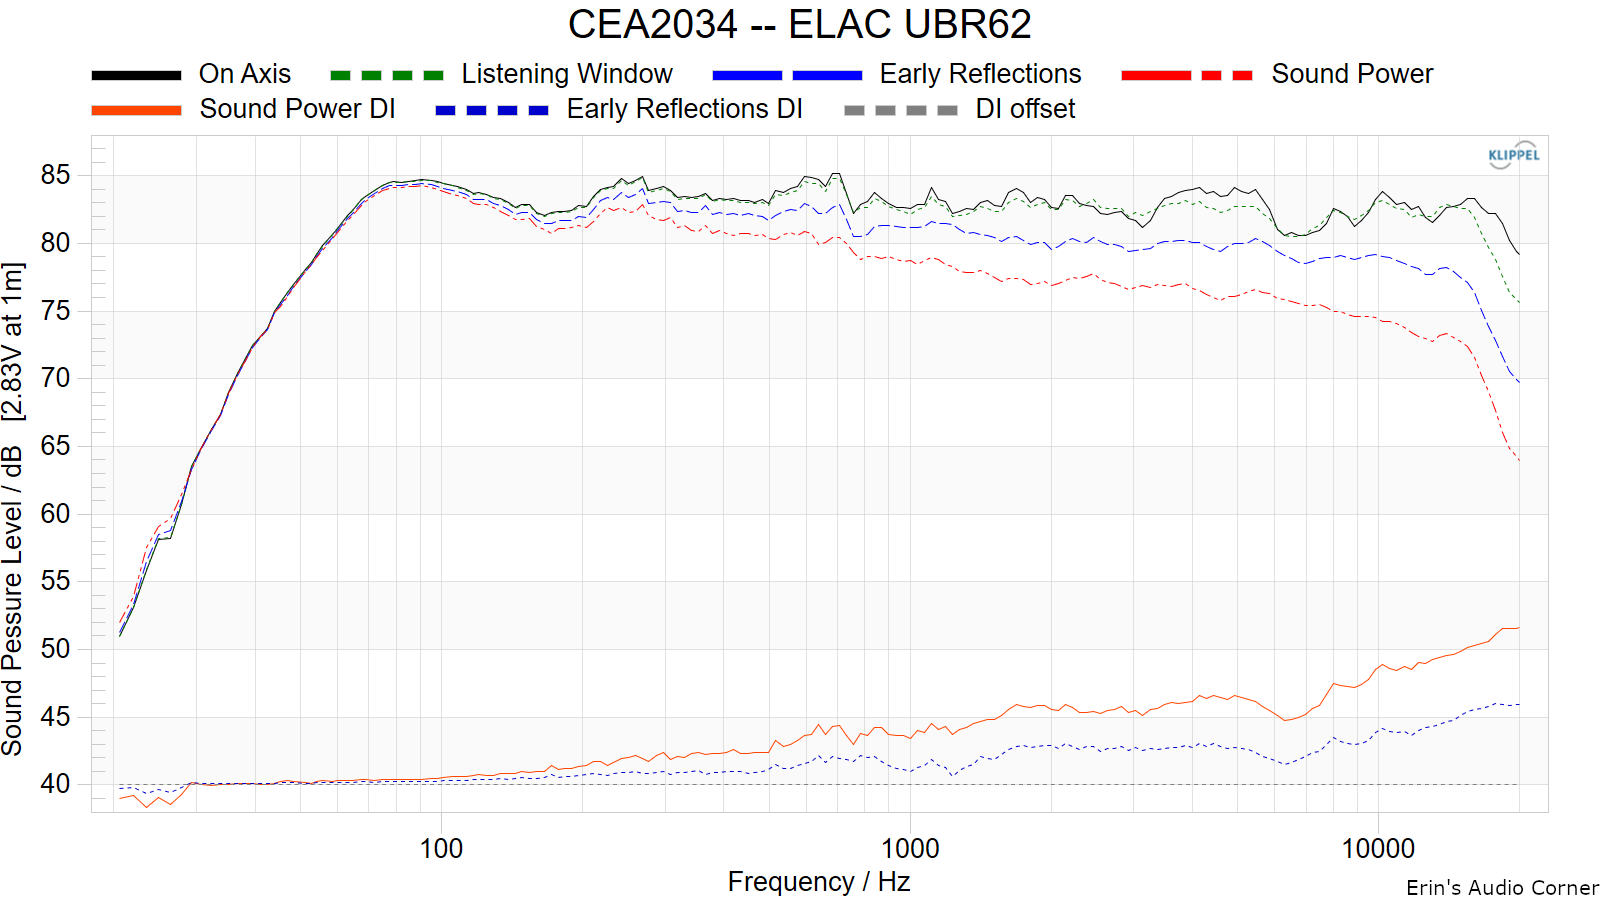
CTA-2034 / SPINORAMA:
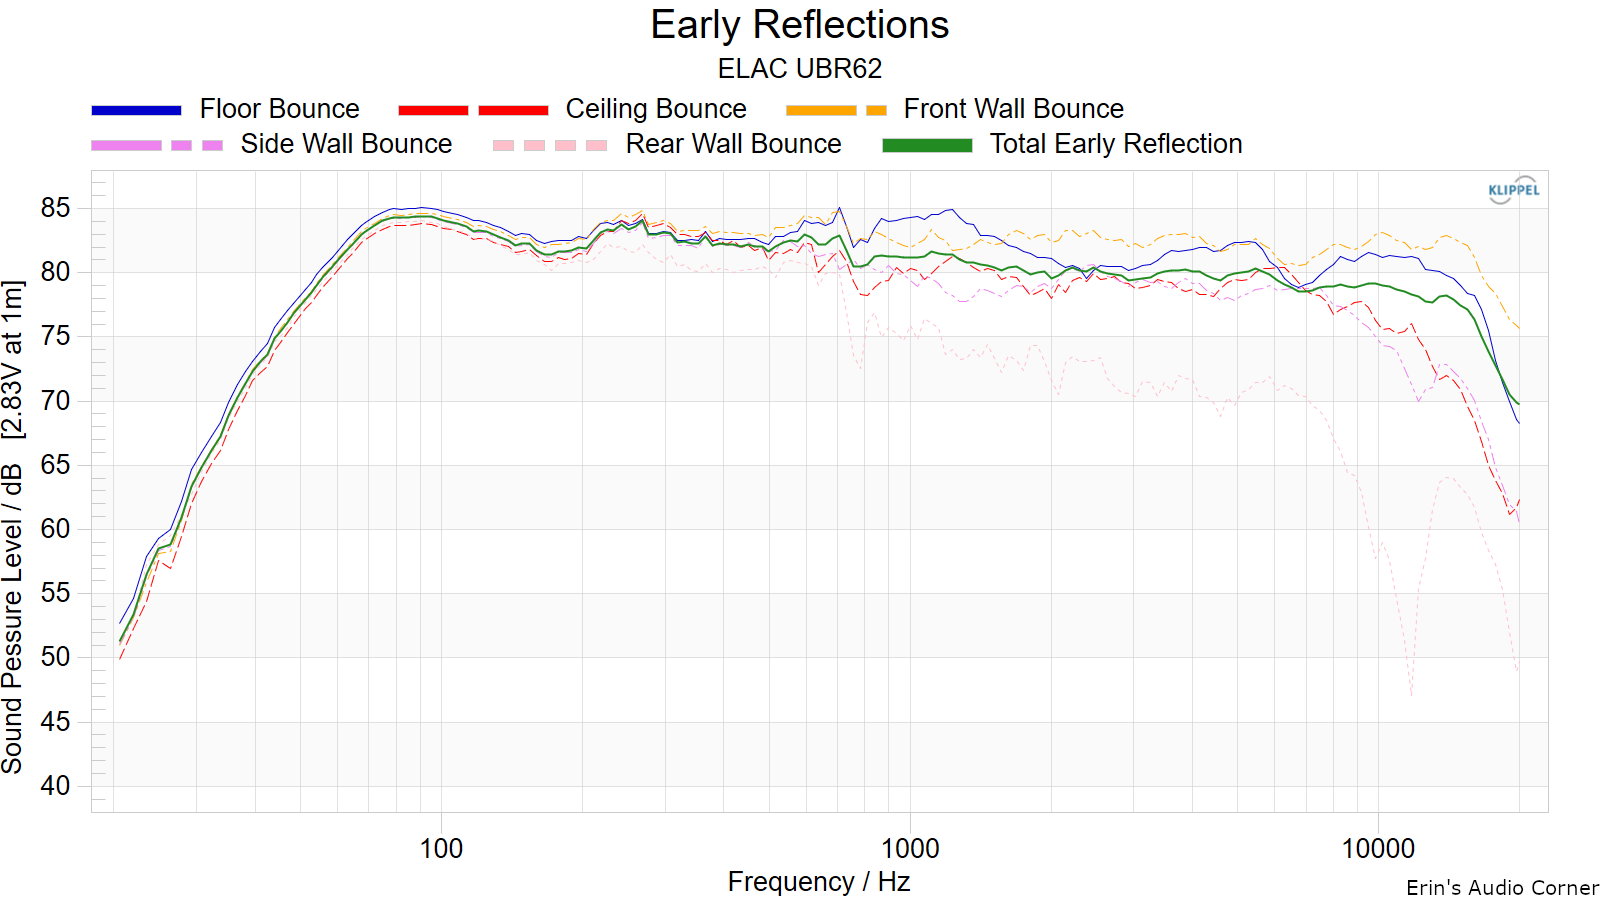
Early Reflections Breakout:
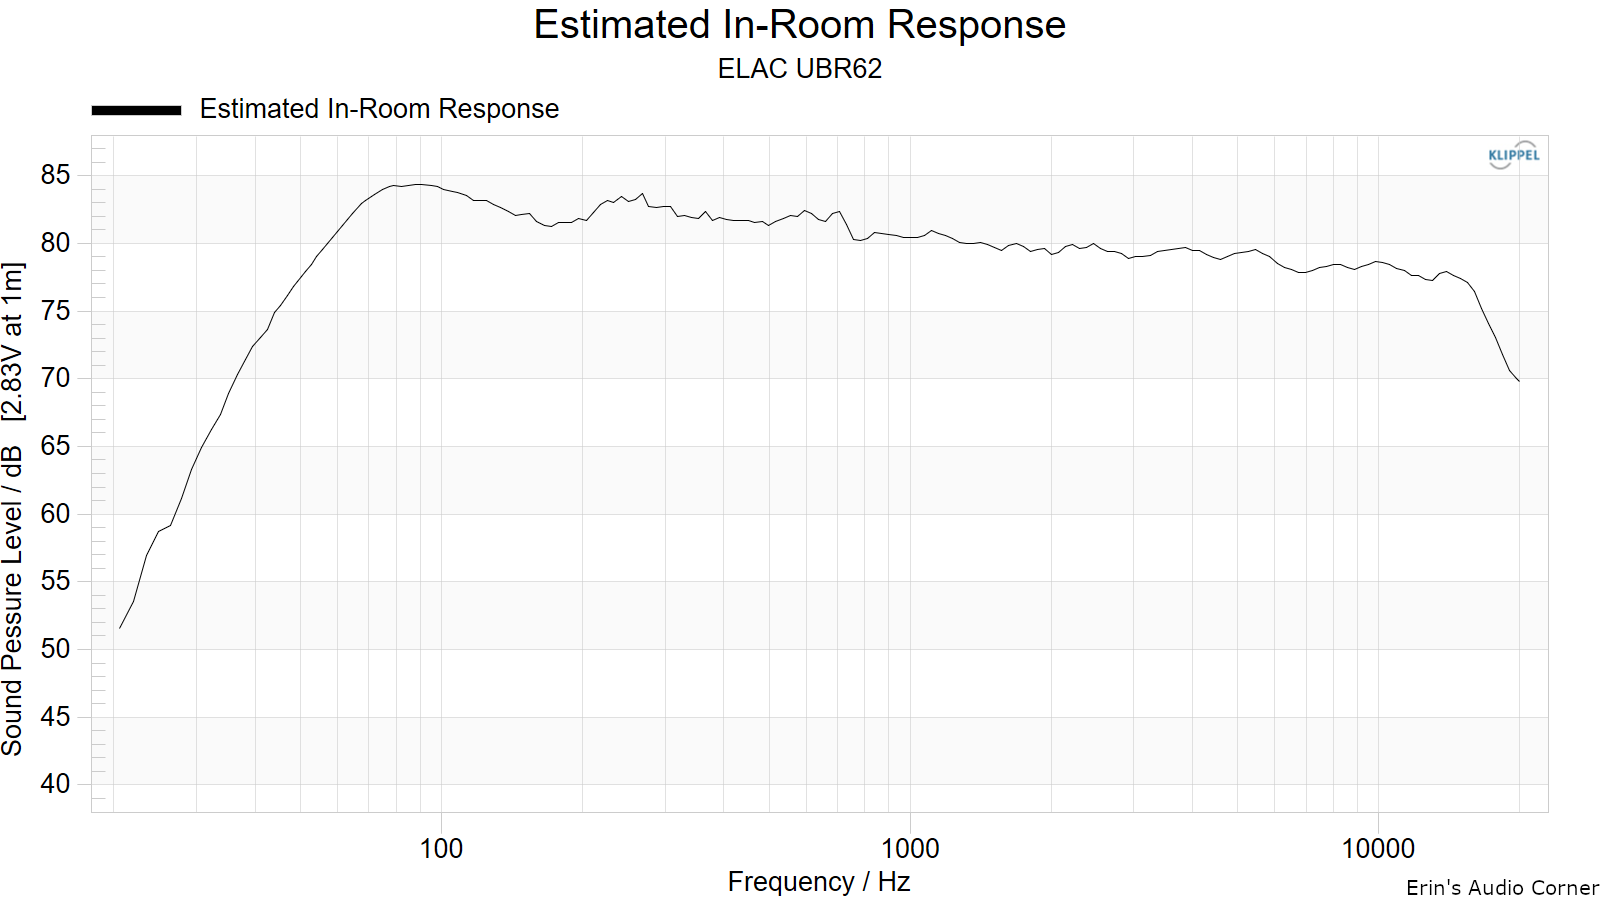
Estimated In-Room Response:
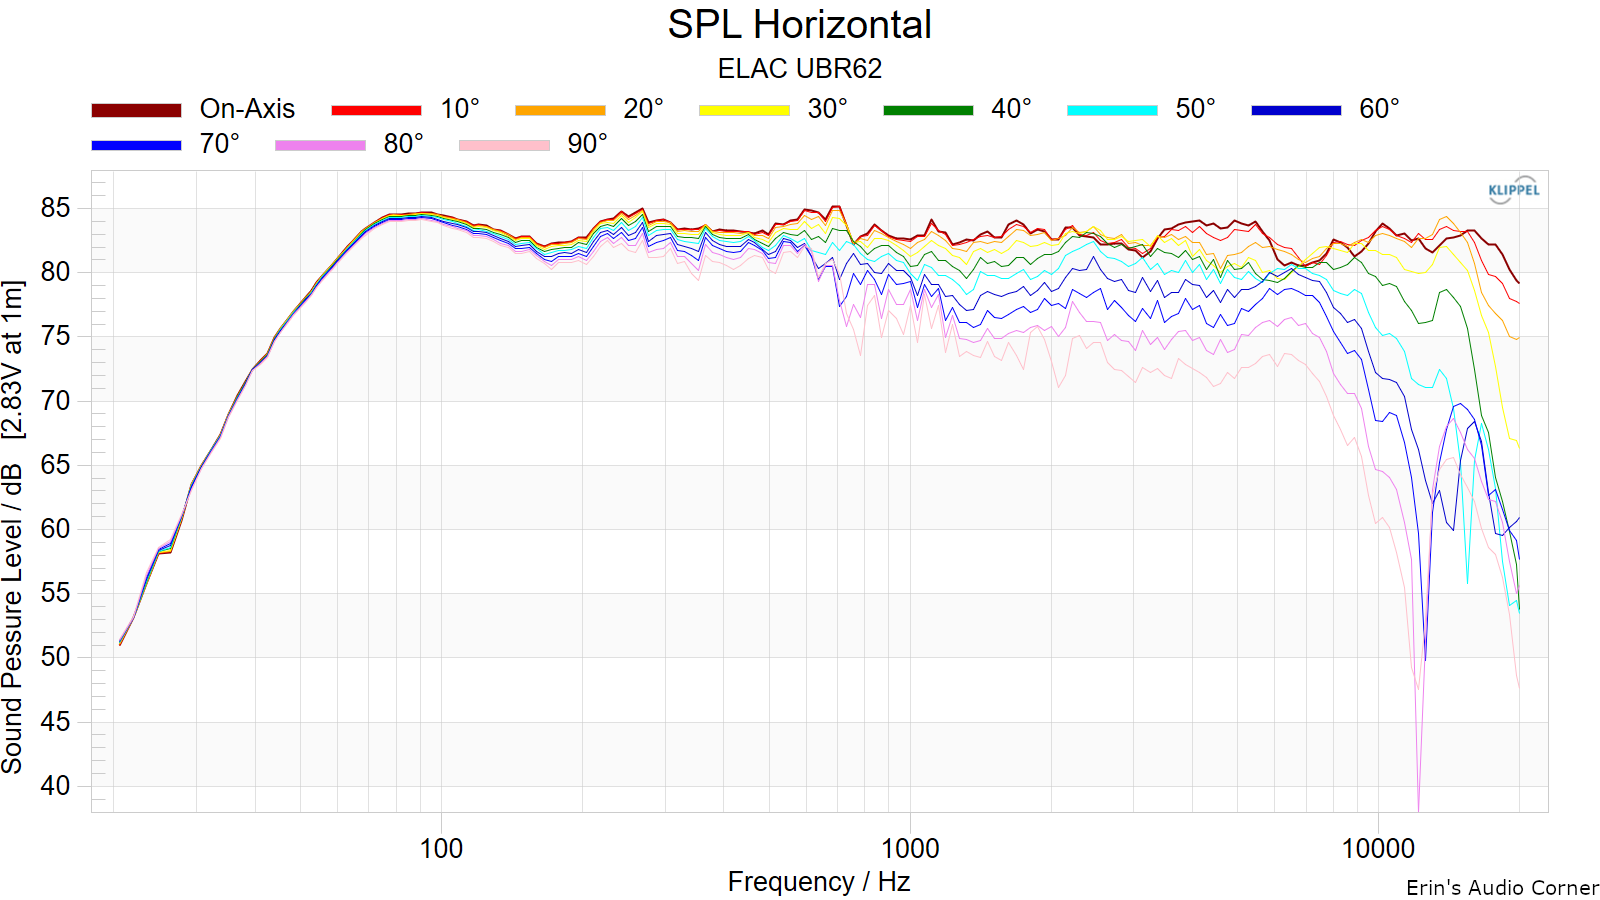
Horizontal Frequency Response (0° to ±90°):
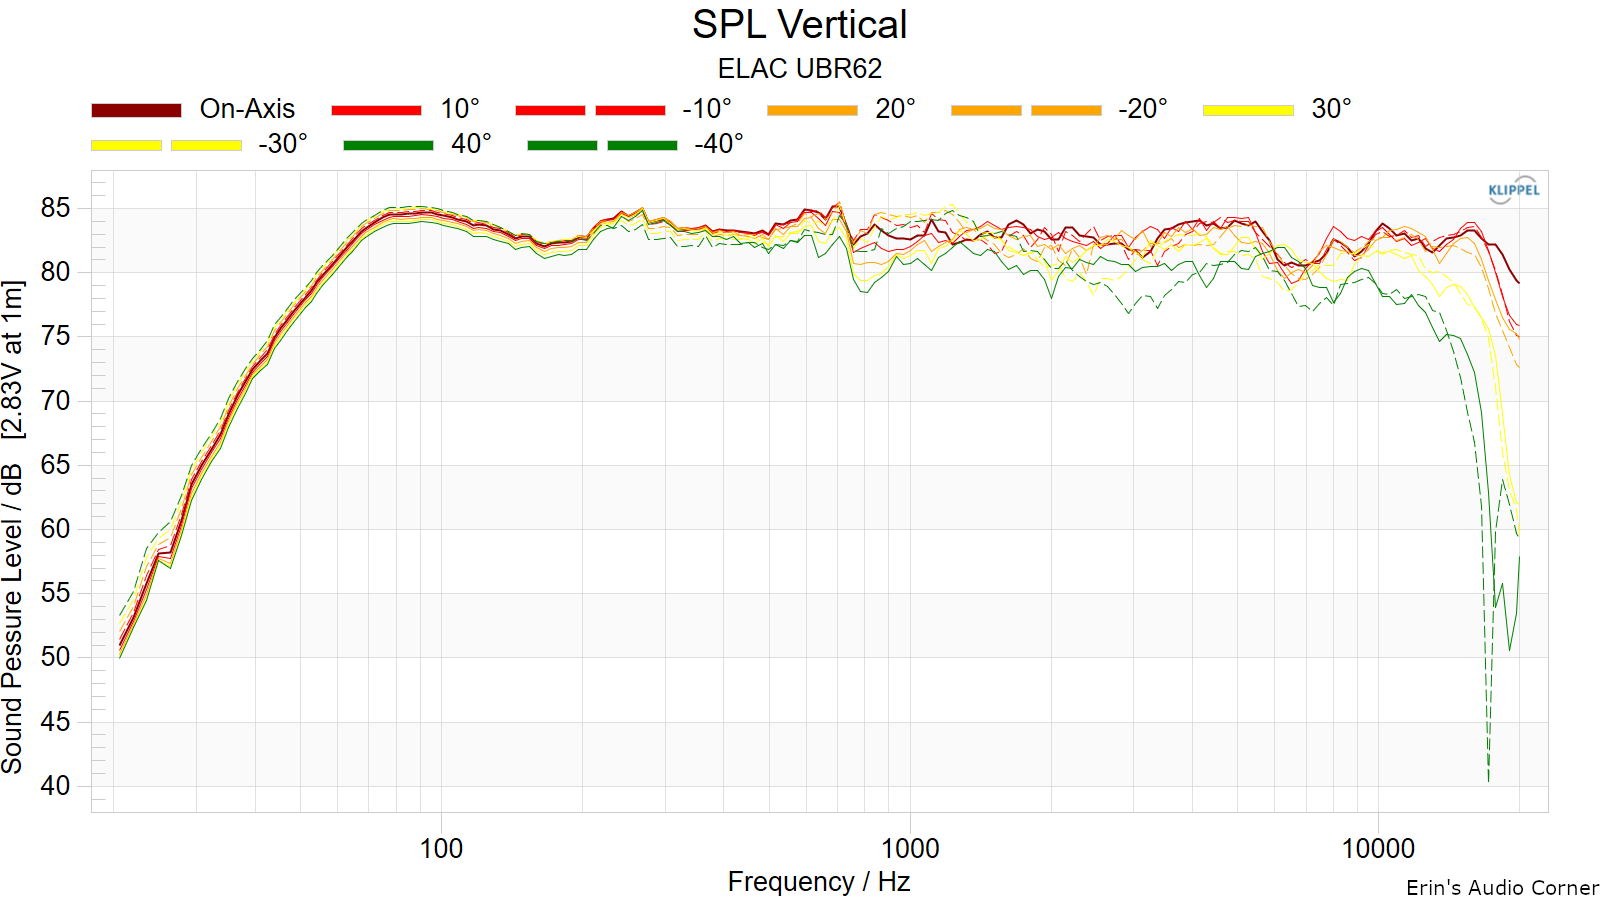
Vertical Frequency Response (0° to ±40°):
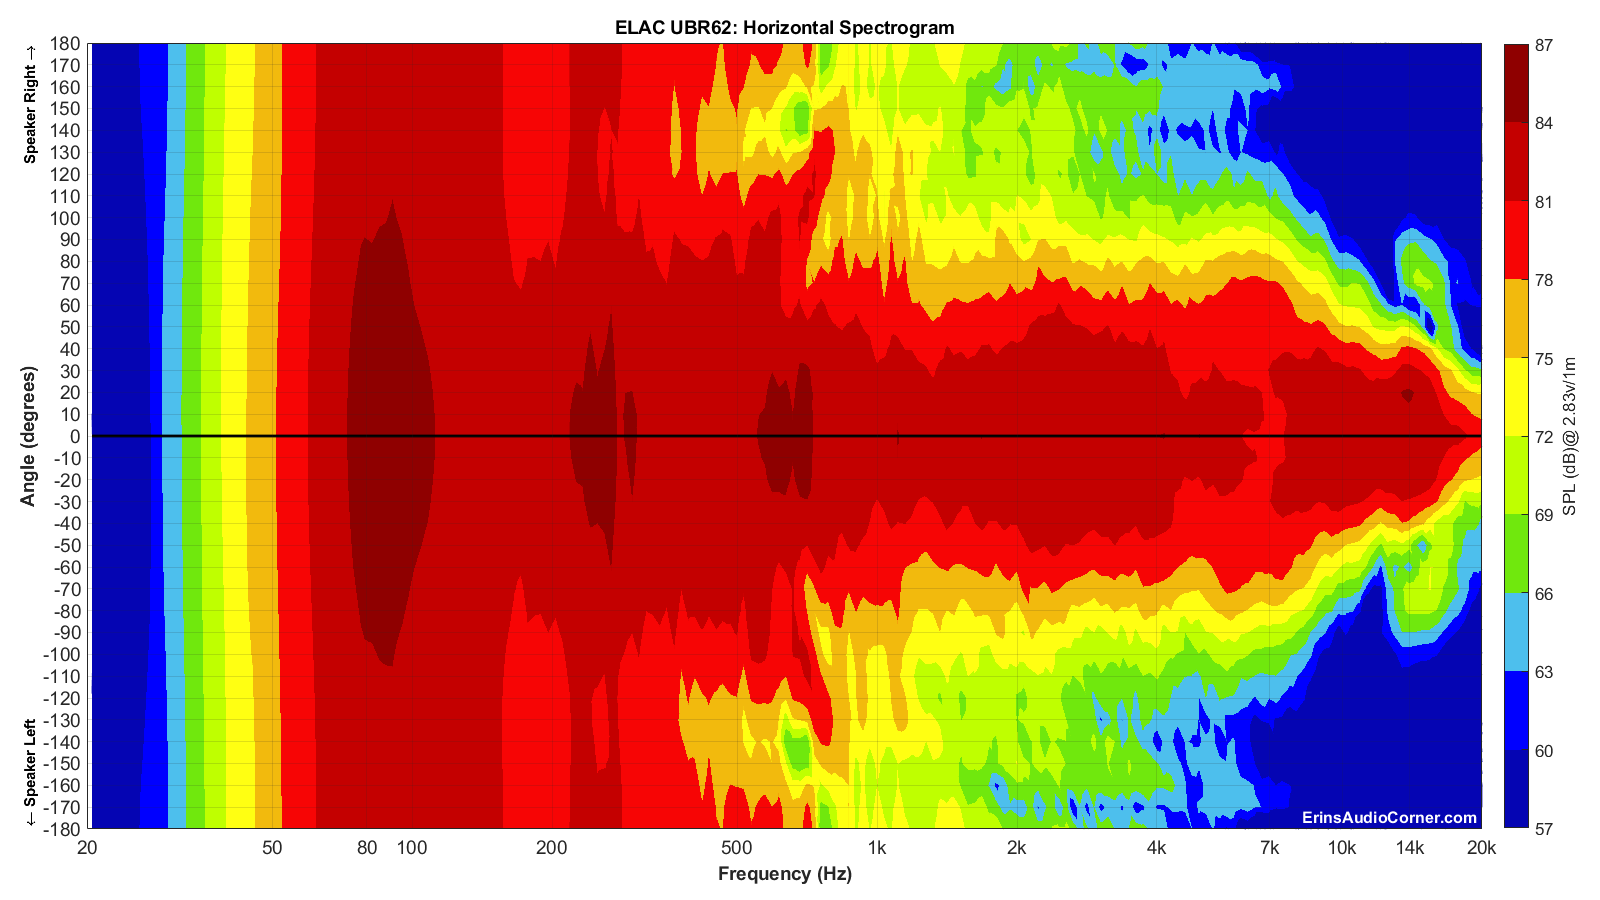
Horizontal Contour Plot (not normalized):
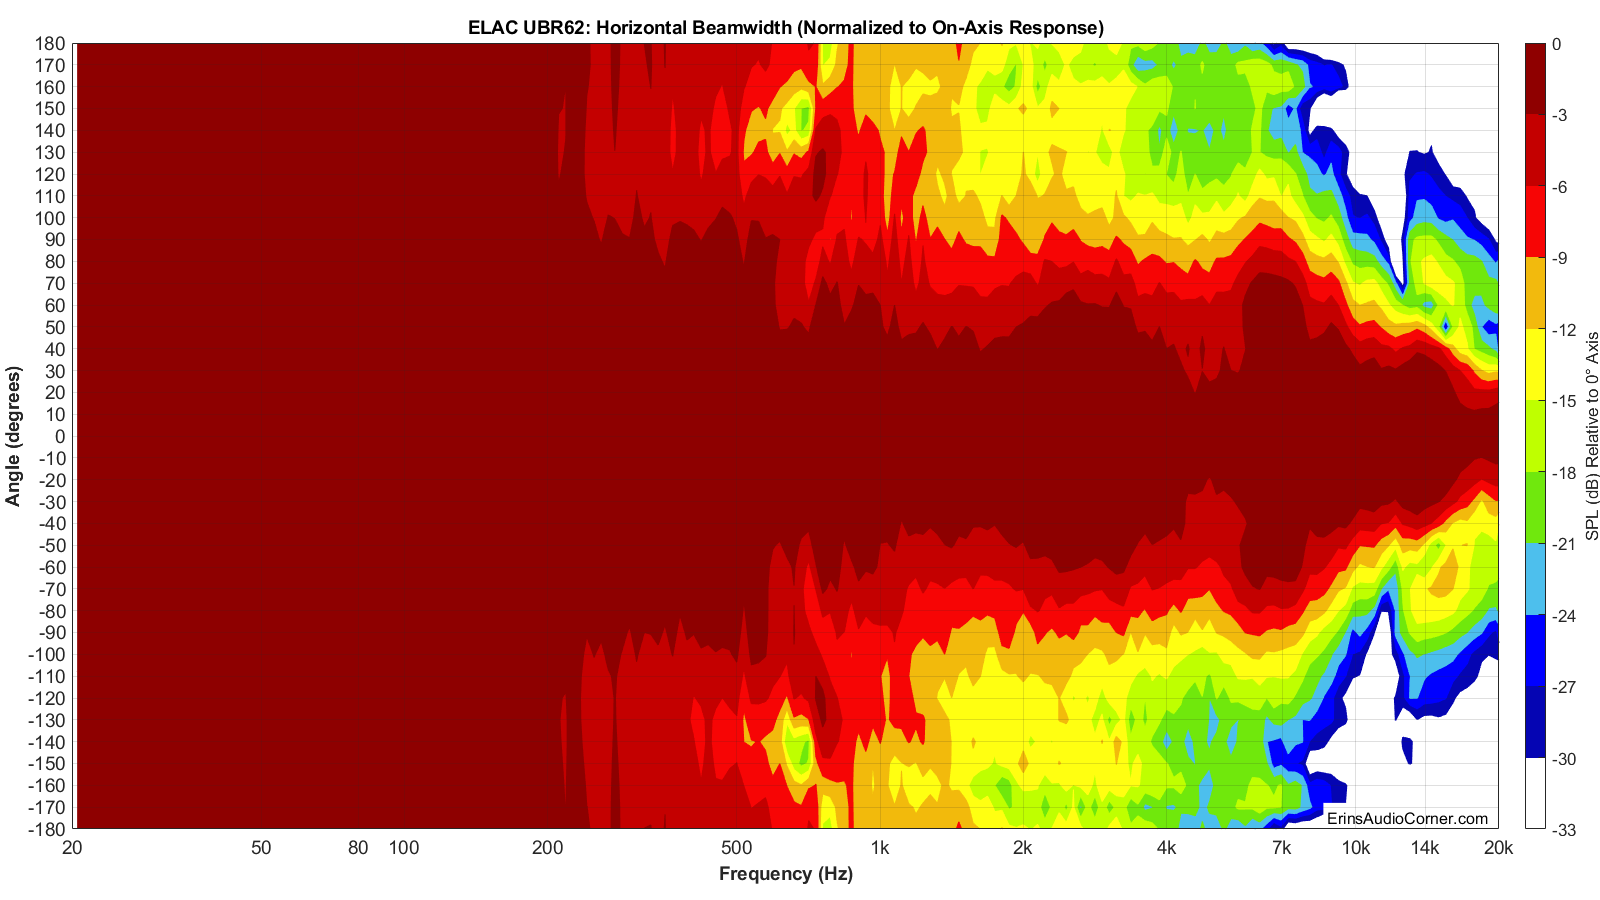
Horizontal Contour Plot (normalized):
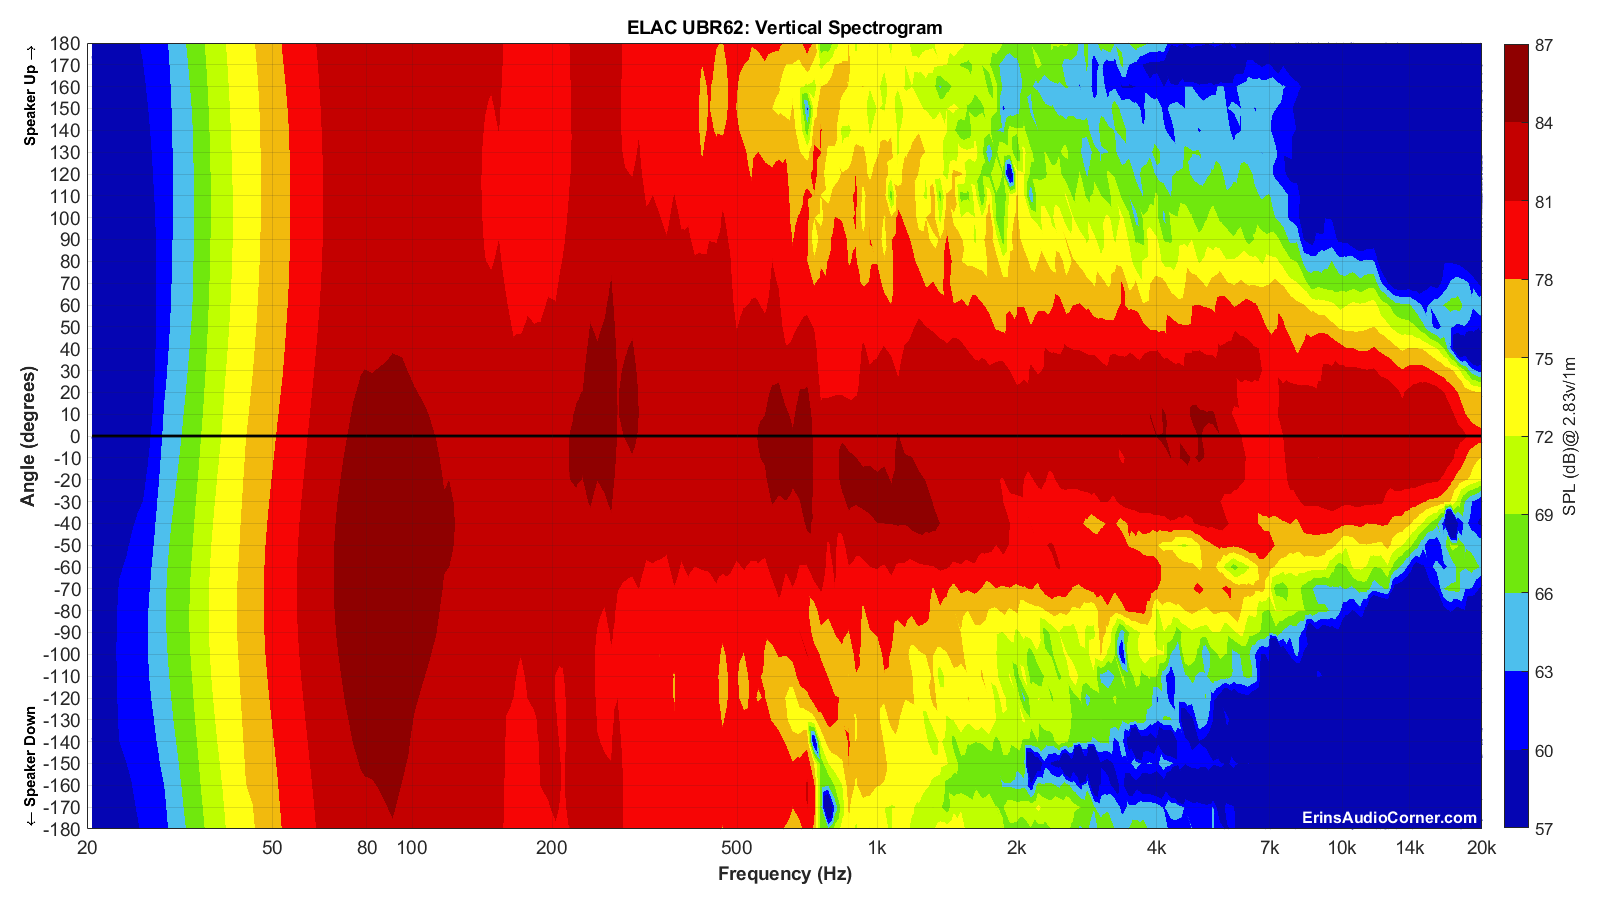
Vertical Contour Plot (not normalized):
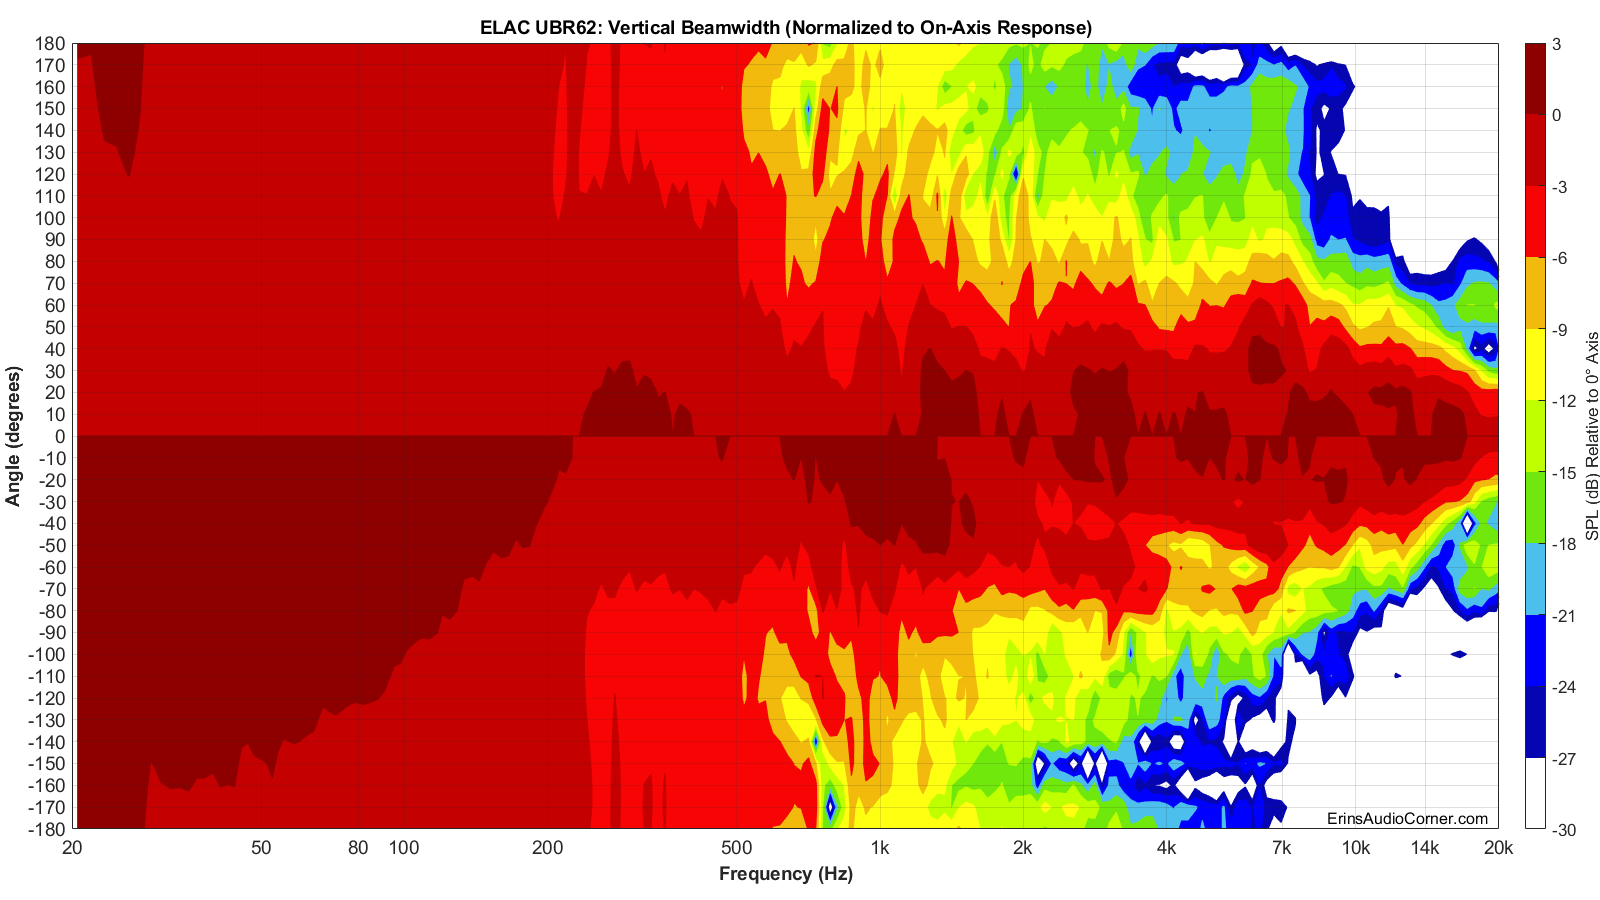
Vertical Contour Plot (normalized):
Additional Measurements
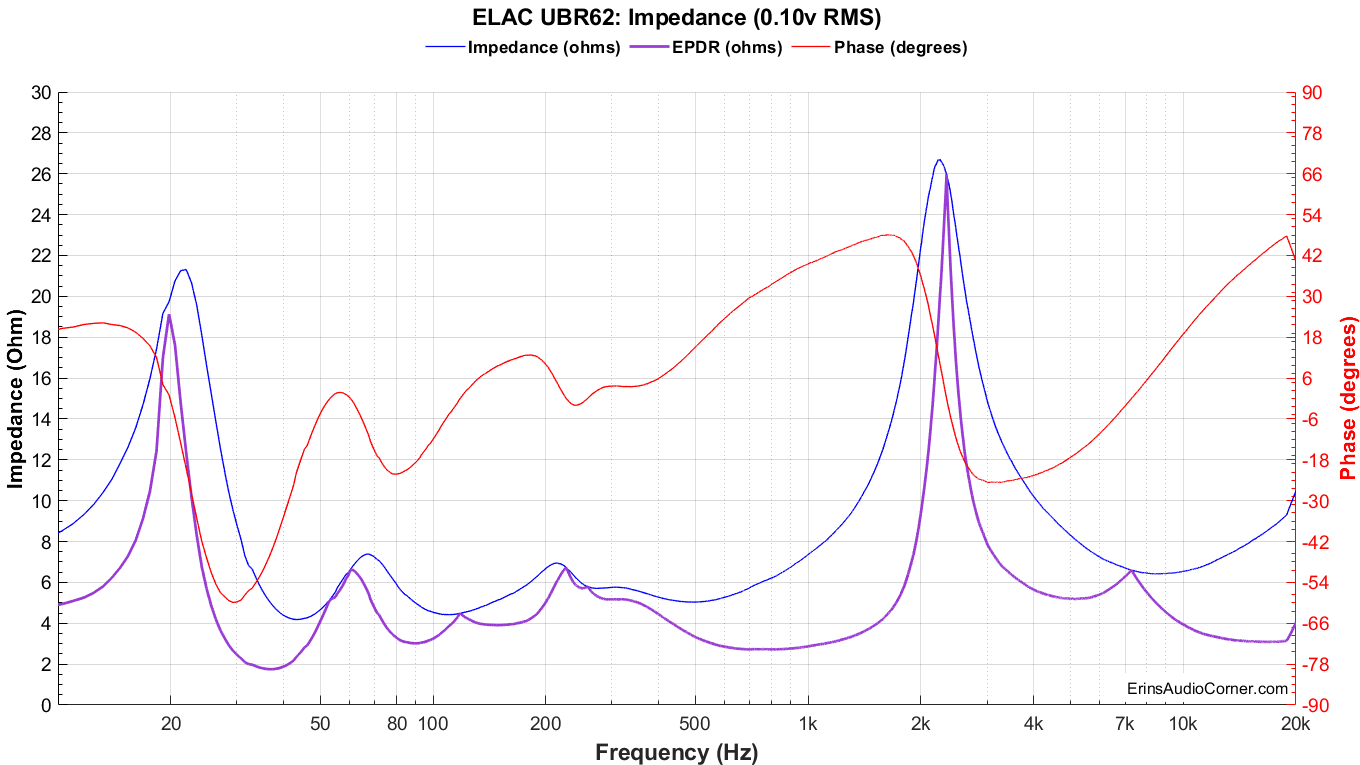
Impedance Magnitude and Phase + Equivalent Peak Dissipation Resistance (EPDR)
For those who do not know what EPDR is (ahem, me until 2020), Keith Howard came up with this metric which he defined in a 2007 article for Stereophile as:
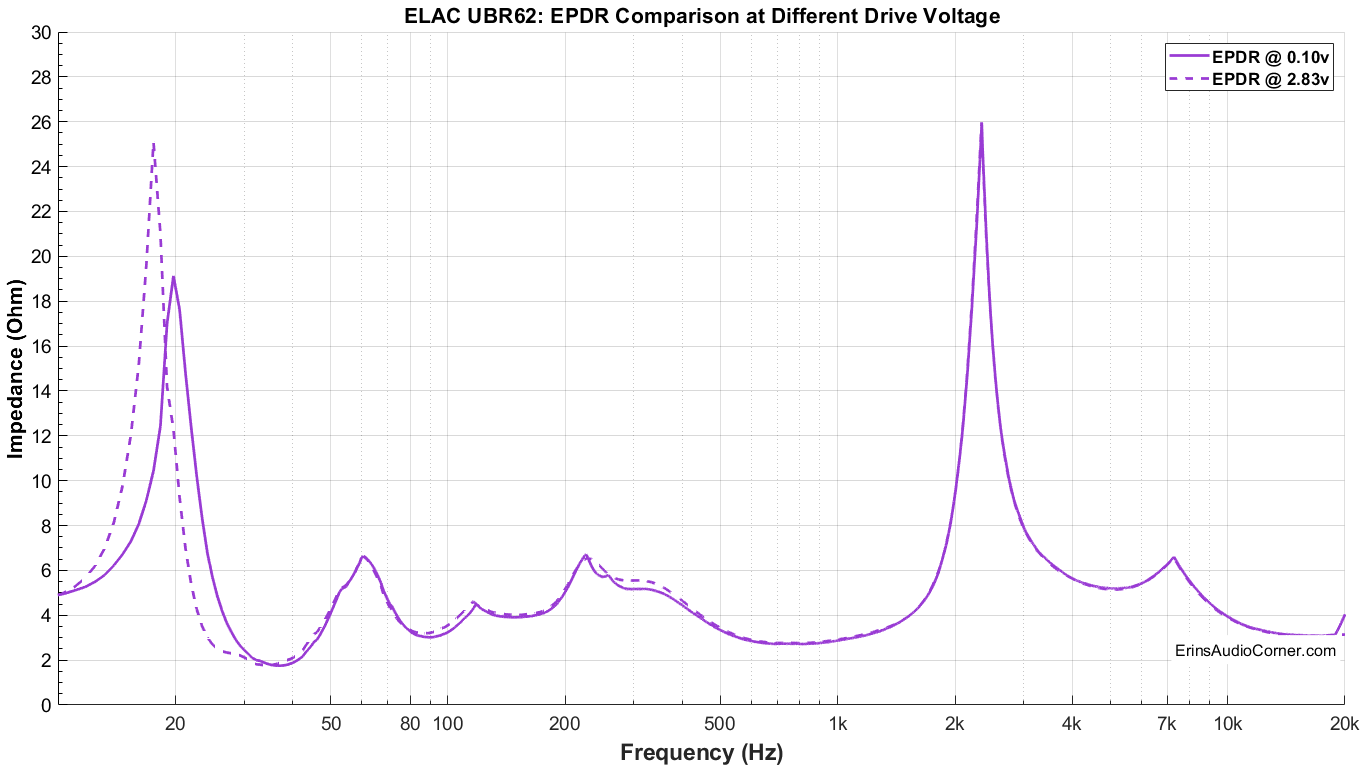
And for those who are curious what happens when you apply more voltage, below is a comparison of the EPDR between 0.10vRMS input and 2.83vRMS input.
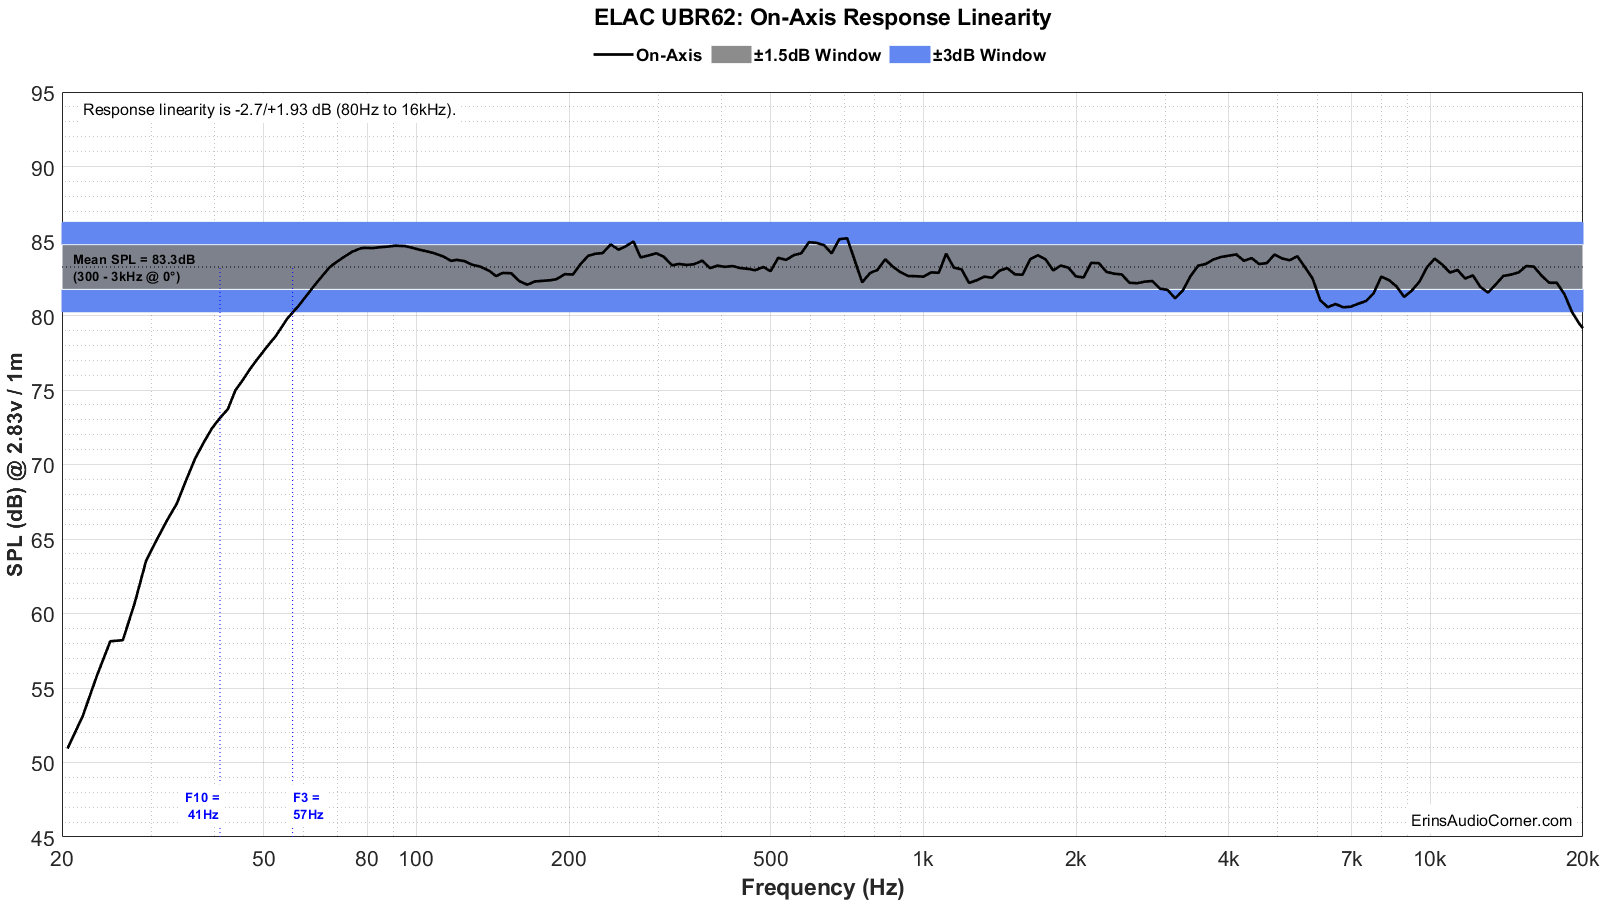
On-Axis Response Linearity
“Globe” Plots
These plots are generated from exporting the Klippel data to text files. I then process that data with my own MATLAB script to provide what you see. These are not part of any software packages and are unique to my tests.
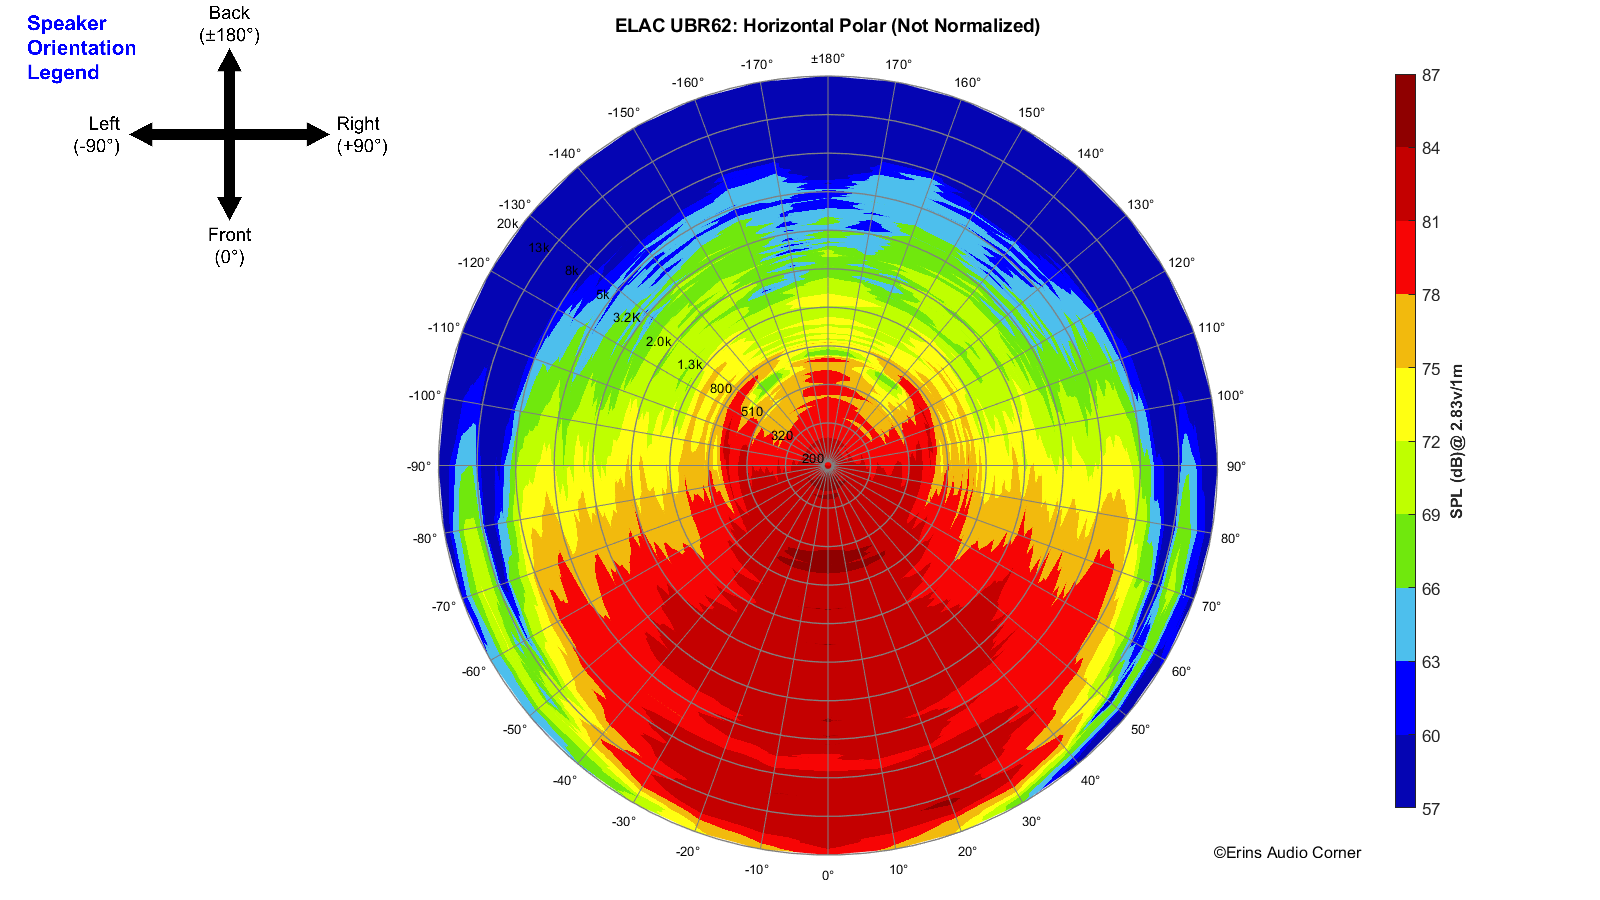
Horizontal Polar (Globe) Plot:
This represents the sound field at 2 meters - above 200Hz - per the legend in the upper left.
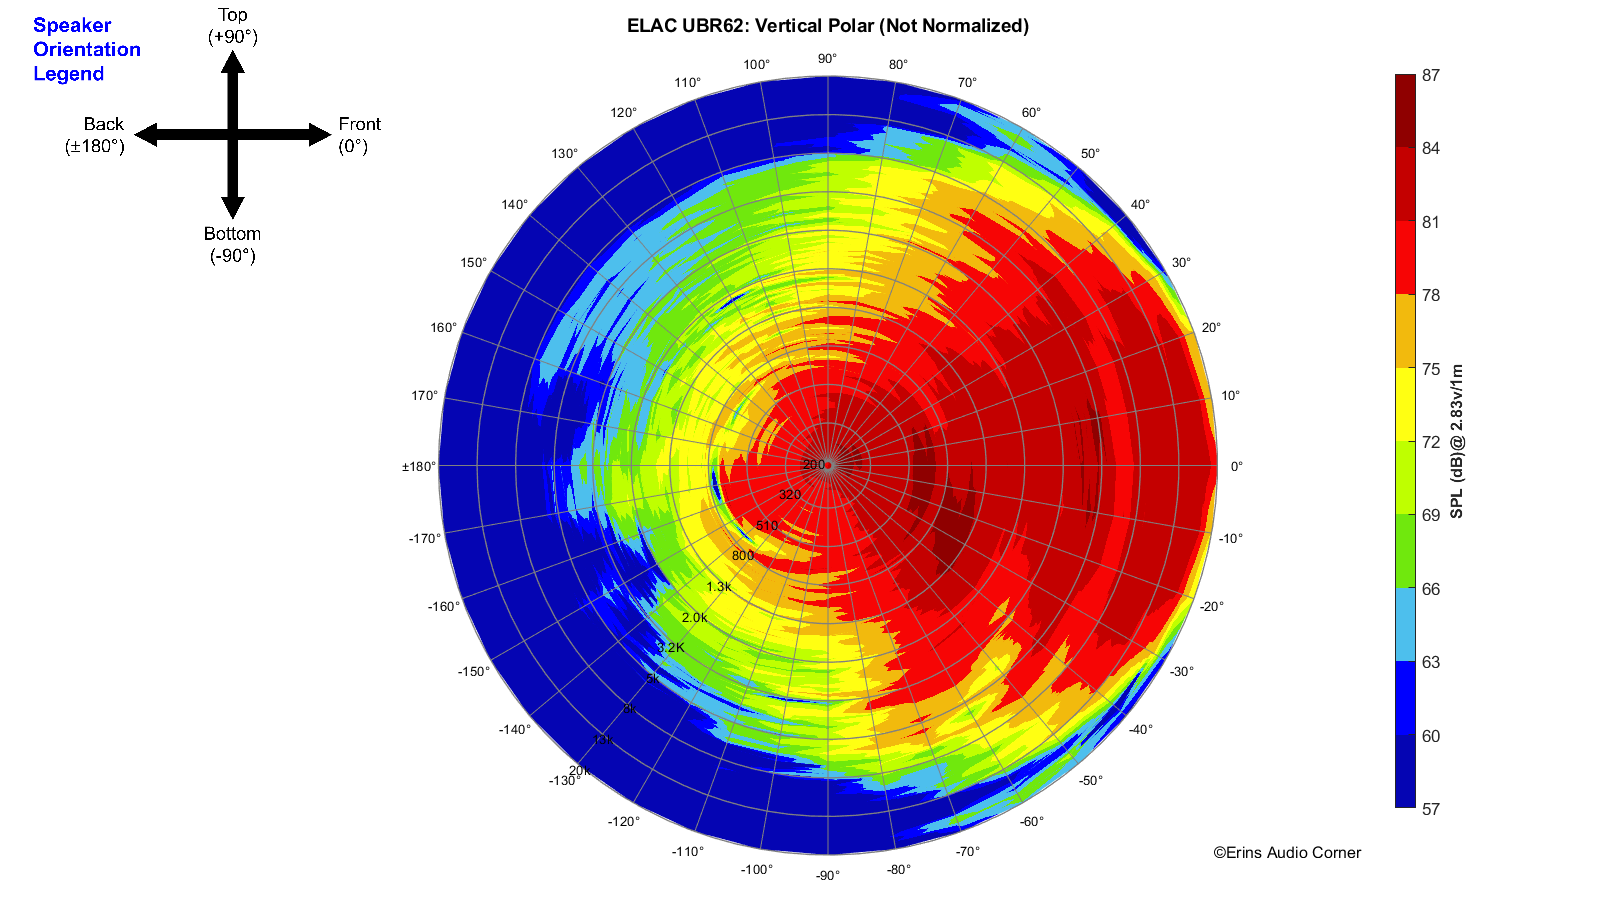
Vertical Polar (Globe) Plot:
This represents the sound field at 2 meters - above 200Hz - per the legend in the upper left.
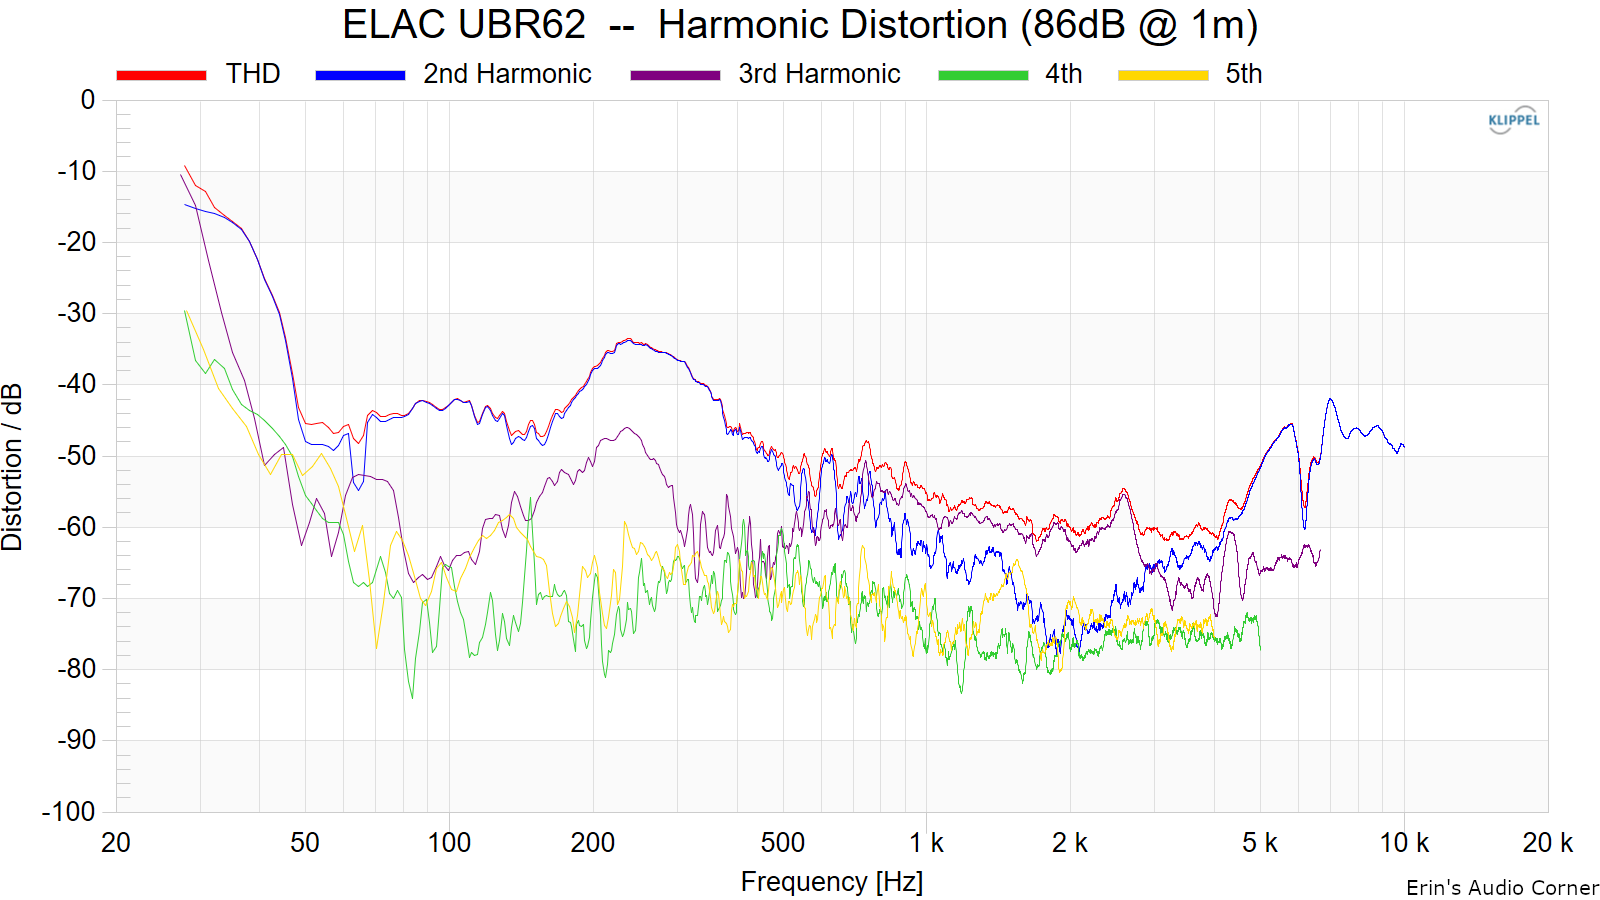
Harmonic Distortion
Harmonic Distortion at 86dB @ 1m:
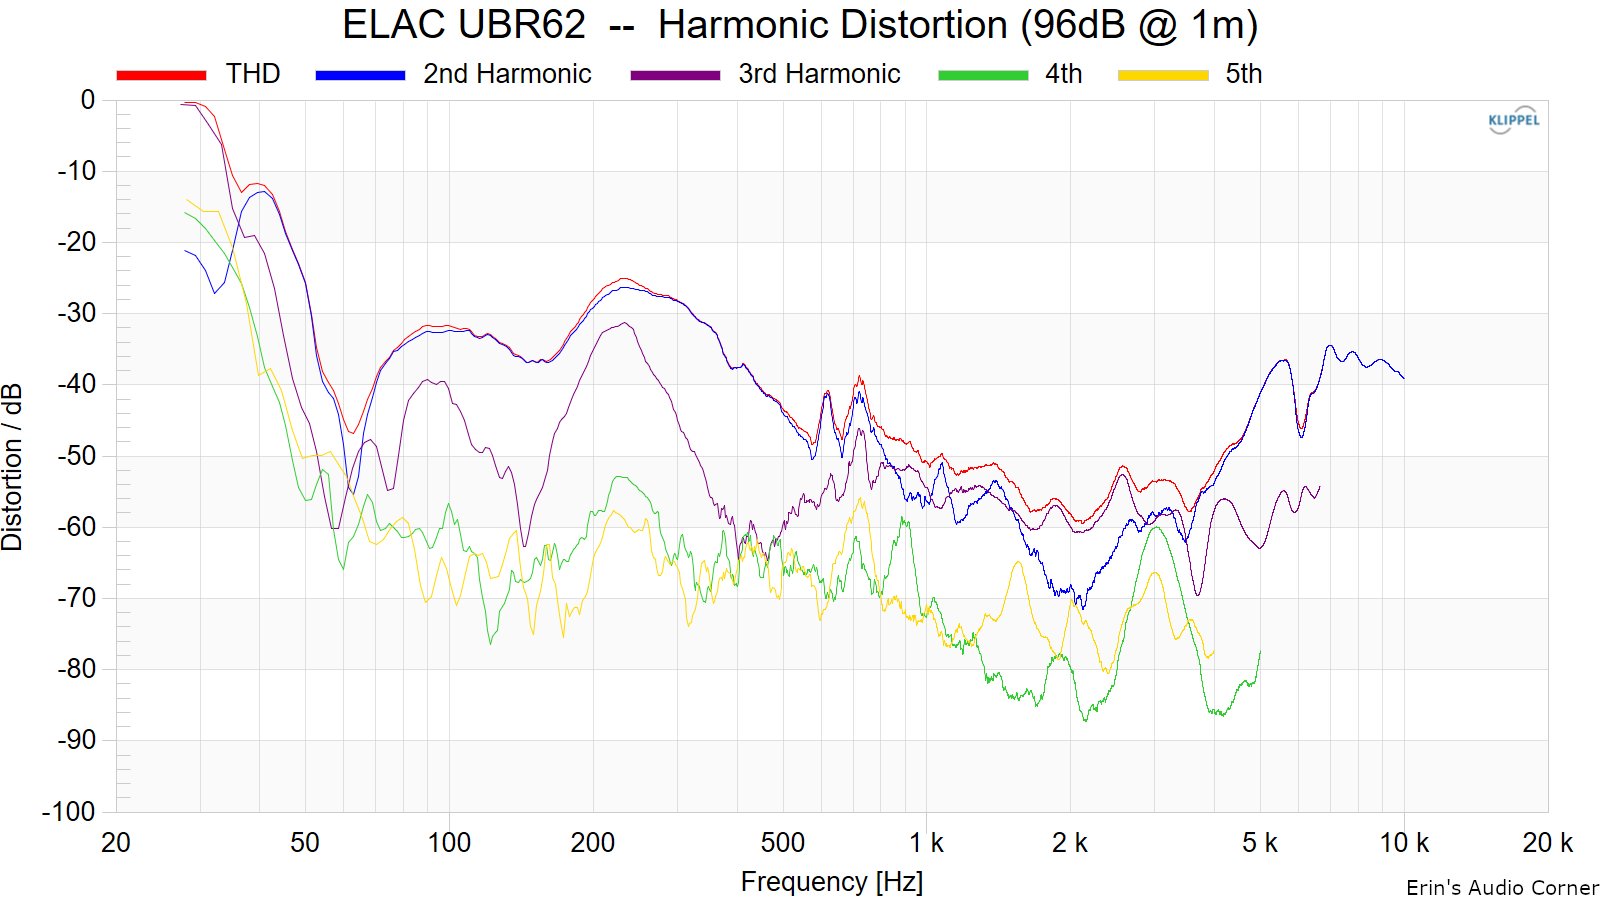
Harmonic Distortion at 96dB @ 1m:
Dynamic Range (Instantaneous Compression Test)
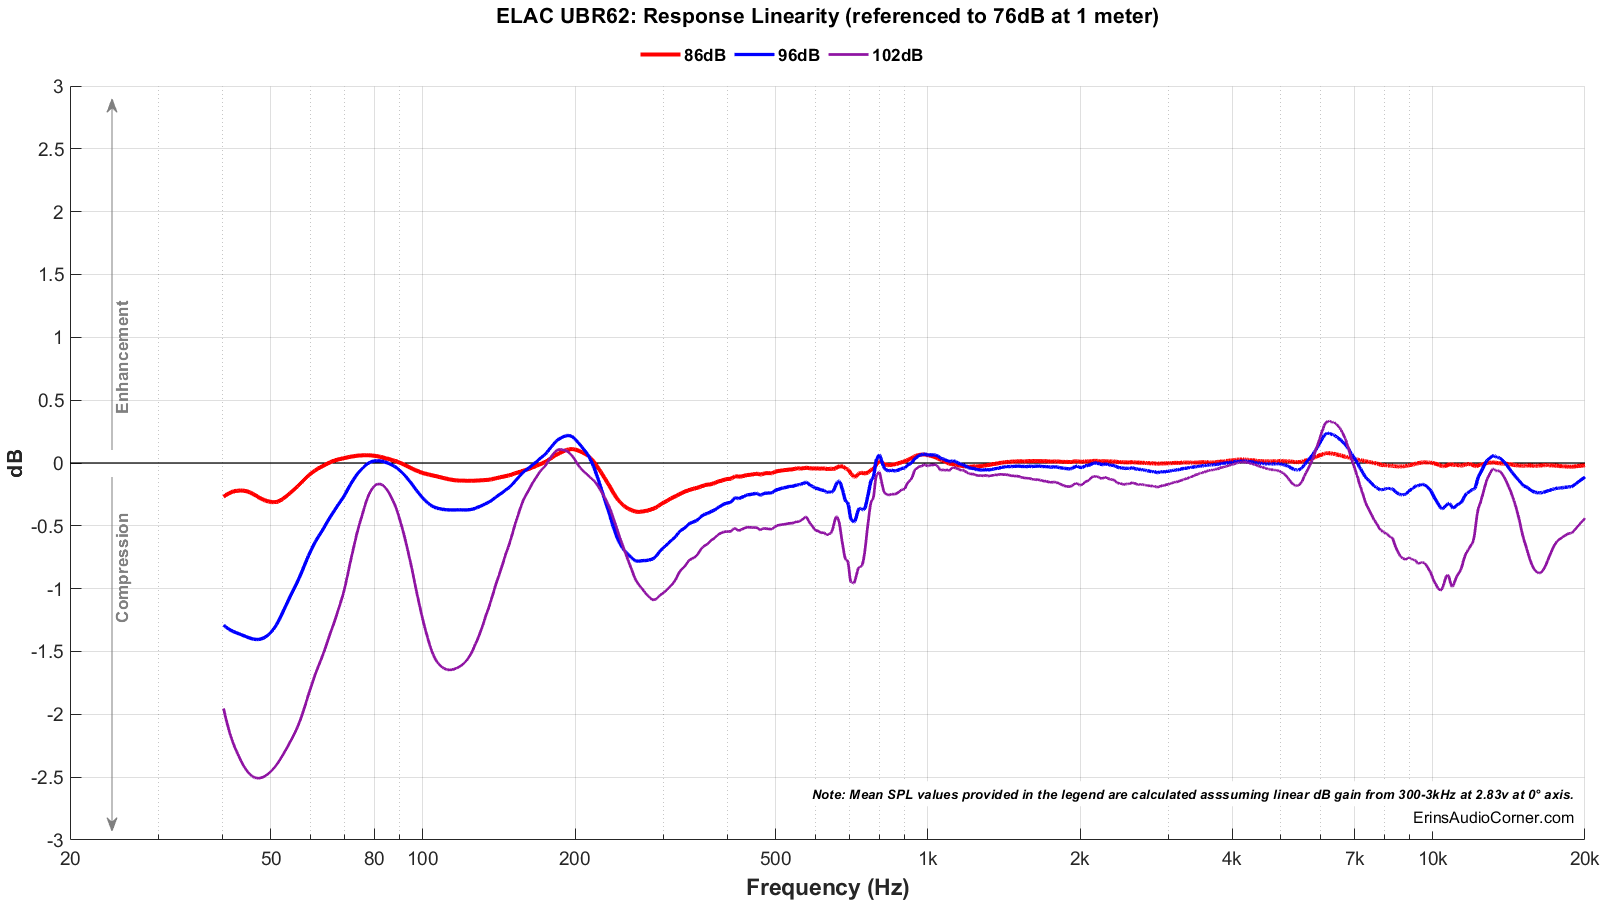
The below graphic indicates just how much SPL is lost (compression) or gained (enhancement; usually due to distortion) when the speaker is played at higher output volumes instantly via a 2.7 second logarithmic sine sweep referenced to 76dB at 1 meter. The signals are played consecutively without any additional stimulus applied. Then normalized against the 76dB result.
The tests are conducted in this fashion:
Long Term Compression Tests
The below graphics indicate how much SPL is lost or gained in the long-term as a speaker plays at the same output level for 2 minutes, in intervals. Each graphic represents a different SPL: 86dB and 96dB both at 1 meter.
The purpose of this test is to illustrate how much (if at all) the output changes as a speaker’s components temperature increases (i.e., voice coils, crossover components).
The tests are conducted in this fashion:
Parting / Random Thoughts
If you want to see the music I use for evaluating speakers subjectively, see my Spotify playlist.
Support / Donate
If you like what you see here and want to help me keep it going, please consider donating via the PayPal Contribute button below. https://www.erinsaudiocorner.com/contribute/
https://www.erinsaudiocorner.com/loudspeakers/elac_ubr62/
ELAC UBR62 Speaker Review
- Monday, Jun 21, 2021
Foreword / YouTube Video Review
The review on this website is a brief overview and summary of the objective performance of this speaker. It is not intended to be a deep dive. Moreso, this is information for those who prefer “just the facts” and prefer to have the data without the filler. Discussion about the data and my subjective thoughts can be found in my video below.
<<coming soon>>
For a primer on what the data means, please watch my series of videos where I provide in-depth discussion and examples of how to read the graphics presented hereon.
https://youtube.com/playlist?list=PLnIxFR_ey0b37Ex4KV2mBz-kYB7QLffR1
Information and Photos
The ELAC UBR62 is a 3-way bookshelf speaker featuring a 6.5-inch midwoofer, 4-inch concentric with 1-inch dome tweeter placed coaxially.
MSRP for a pair of the UBR62 speakers is currently $999 USD.
CTA-2034 (SPINORAMA) and Accompanying Data
All data collected using Klippel’s Near-Field Scanner. The Near-Field-Scanner 3D (NFS) offers a fully automated acoustic measurement of direct sound radiated from the source under test. The radiated sound is determined in any desired distance and angle in the 3D space outside the scanning surface. Directivity, sound power, SPL response and many more key figures are obtained for any kind of loudspeaker and audio system in near field applications (e.g. studio monitors, mobile devices) as well as far field applications (e.g. professional audio systems). Utilizing a minimum of measurement points, a comprehensive data set is generated containing the loudspeaker’s high resolution, free field sound radiation in the near and far field. For a detailed explanation of how the NFS works and the science behind it, please watch the below discussion with designer Christian Bellmann:
The reference plane in this test is at the tweeter.
Measurements are provided in a format in accordance with the Standard Method of Measurement for In-Home Loudspeakers (ANSI/CTA-2034-A R-2020). For more information, please see this link.
CTA-2034 / SPINORAMA:
Early Reflections Breakout:
Estimated In-Room Response:
Horizontal Frequency Response (0° to ±90°):
Vertical Frequency Response (0° to ±40°):
Horizontal Contour Plot (not normalized):
Horizontal Contour Plot (normalized):
Vertical Contour Plot (not normalized):
Vertical Contour Plot (normalized):
Additional Measurements
Impedance Magnitude and Phase + Equivalent Peak Dissipation Resistance (EPDR)
For those who do not know what EPDR is (ahem, me until 2020), Keith Howard came up with this metric which he defined in a 2007 article for Stereophile as:
… simply the resistive load that would give rise to the same peak device dissipation as the speaker itself.
A note from Dr. Jack Oclee-Brown of Kef (who supplied the formula for calculating EPDR):Just a note of caution that the EPDR derivation is based on a class-B output stage so it’s valid for typical class-AB amps but certainly not for class-A and probably has only marginal relevance for class-D amps (would love to hear from a class-D expert on this topic).
And for those who are curious what happens when you apply more voltage, below is a comparison of the EPDR between 0.10vRMS input and 2.83vRMS input.
On-Axis Response Linearity
“Globe” Plots
These plots are generated from exporting the Klippel data to text files. I then process that data with my own MATLAB script to provide what you see. These are not part of any software packages and are unique to my tests.
Horizontal Polar (Globe) Plot:
This represents the sound field at 2 meters - above 200Hz - per the legend in the upper left.
Vertical Polar (Globe) Plot:
This represents the sound field at 2 meters - above 200Hz - per the legend in the upper left.
Harmonic Distortion
Harmonic Distortion at 86dB @ 1m:
Harmonic Distortion at 96dB @ 1m:
Dynamic Range (Instantaneous Compression Test)
The below graphic indicates just how much SPL is lost (compression) or gained (enhancement; usually due to distortion) when the speaker is played at higher output volumes instantly via a 2.7 second logarithmic sine sweep referenced to 76dB at 1 meter. The signals are played consecutively without any additional stimulus applied. Then normalized against the 76dB result.
The tests are conducted in this fashion:
- 76dB at 1 meter (baseline; black)
- 86dB at 1 meter (red)
- 96dB at 1 meter (blue)
- 102dB at 1 meter (purple)
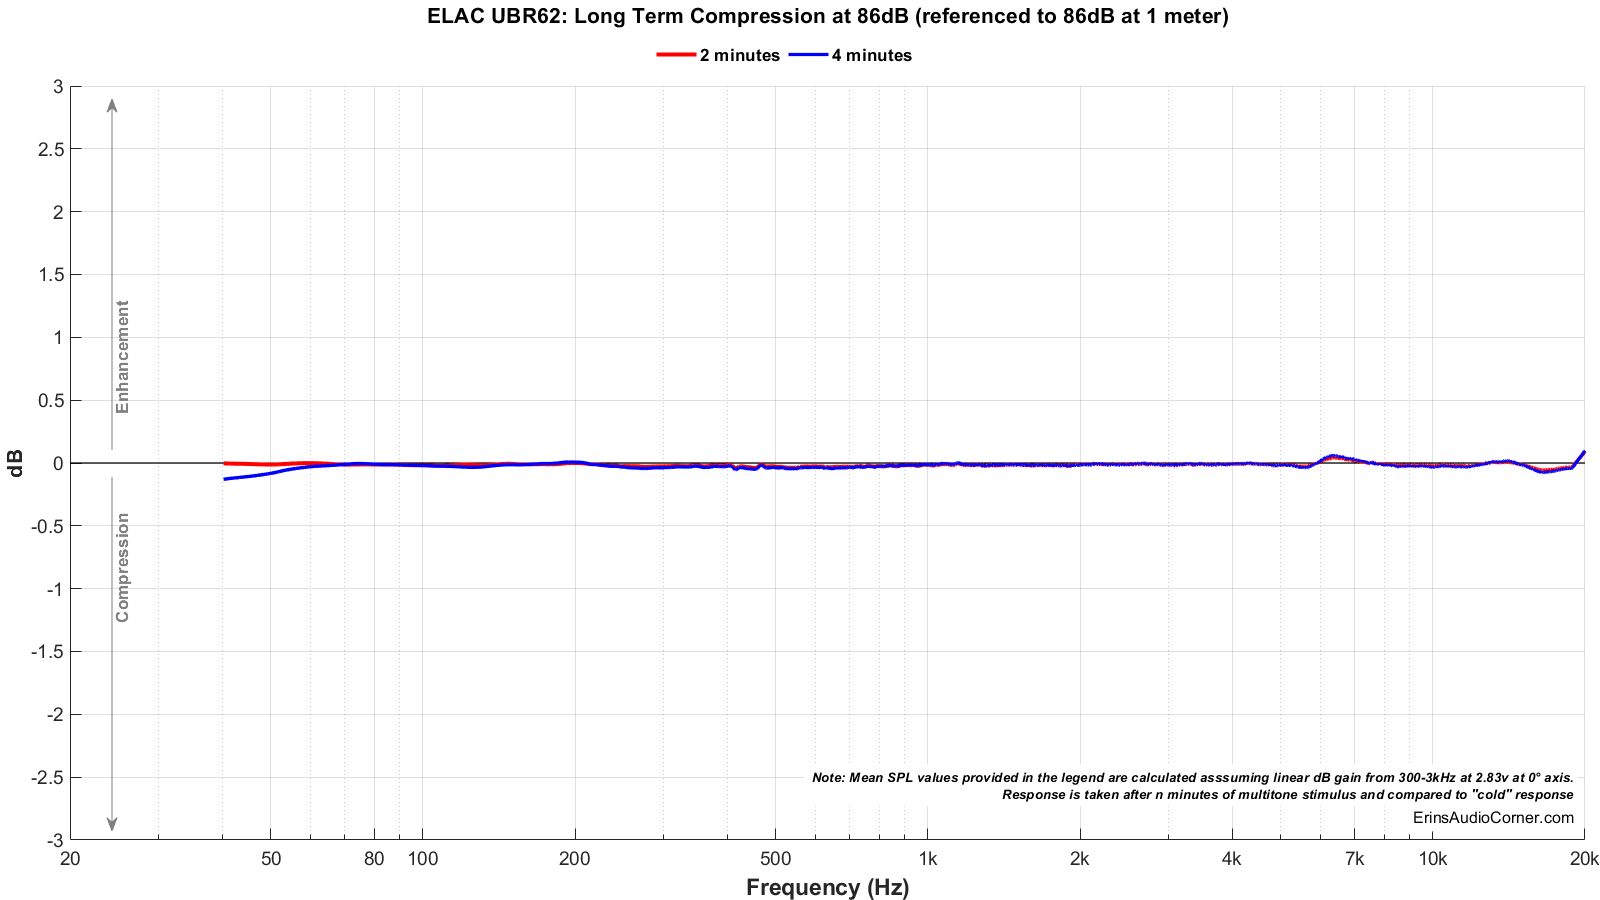
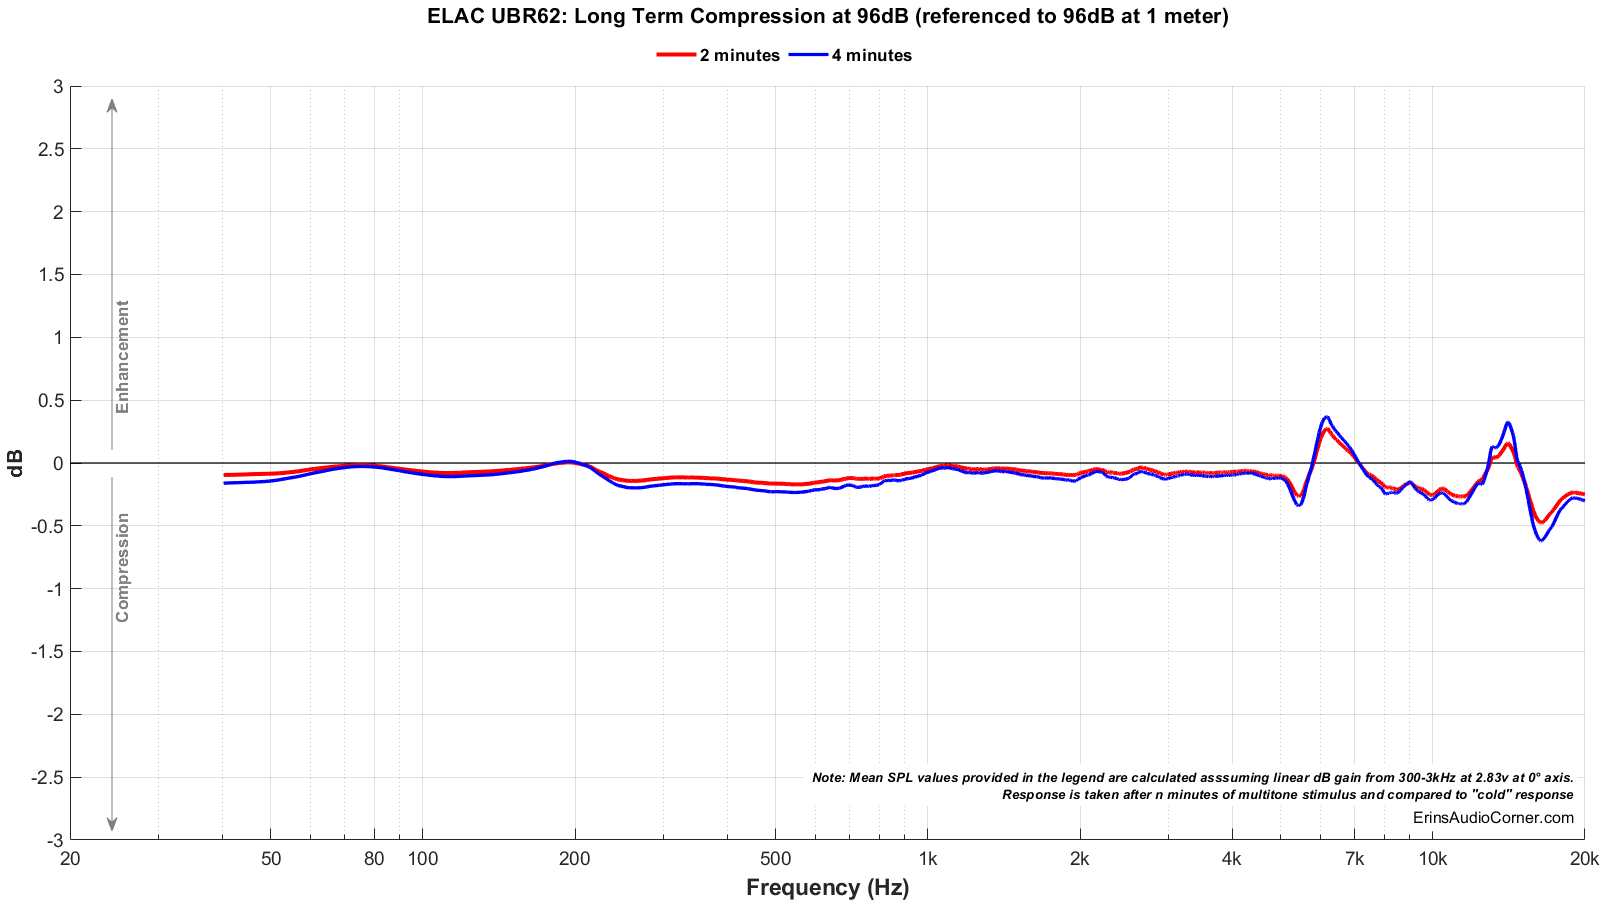
Long Term Compression Tests
The below graphics indicate how much SPL is lost or gained in the long-term as a speaker plays at the same output level for 2 minutes, in intervals. Each graphic represents a different SPL: 86dB and 96dB both at 1 meter.
The purpose of this test is to illustrate how much (if at all) the output changes as a speaker’s components temperature increases (i.e., voice coils, crossover components).
The tests are conducted in this fashion:
- “Cold” logarithmic sine sweep (no stimulus applied beforehand)
- Multitone stimulus played at desired SPL/distance for 2 minutes; intended to represent music signal
- Interim logarithmic sine sweep (no stimulus applied beforehand) (Red in graphic)
- Multitone stimulus played at desired SPL/distance for 2 minutes; intended to represent music signal
- Final logarithmic sine sweep (no stimulus applied beforehand) (Blue in graphic)
Parting / Random Thoughts
If you want to see the music I use for evaluating speakers subjectively, see my Spotify playlist.
- Subjective listening was mainly in the farfield at 3-4 meters in an open floorplan living room. Subjective listening was conducted at 80-95dB at these distances and occasionally higher. Higher volumes were done simply to test the output capability in case one wants to try to sit further away.
- For a coincident/coaxial speaker, the dispersion is rather wide. And I liked that. If you follow my reviews enough you know I like a wide soundstage and that is typically related directly to the radiation pattern of the speaker. I attribute this to the rather shallow cone profile of the midrange relative to other coaxial speakers I have tested.
- Similarly, notice the on-axis response is a bit slanted downward. Now, look at the estimated in-room response. Notice how the estimated in room response has an excellent downward linearity to it? In my experience, if the on-axis response of this speaker were actually flat the in-room response would be a bit flat in the tweeter region, making the overall sound to present itself as a bit “bright” or “treble heavy” at the listening position. In other words, wide radiation speakers reflect more energy back to the listening position so - in my opinion - the design response was purposely tilted downward so that the response at the seated position would result in an overall sloping response rather than a response that has a “knee”.
- On-axis listening for most coaxial designs is typically the worst location to listen within. These speakers are best listened to slightly toed in or out (depending on how much room interaction you want) by about 10°.
- With the low sensitivity of about 83dB @ 2.83v/1m, these will need some power to get to higher output levels. But also consider what the dynamic compression tests indicate; that there is compression going above 96dB. Realistically, this would be expected of a small, lower sensitivity speaker. And one would also use a subwoofer to help alleviate the bass driver of trying to overextend itself.
Support / Donate
If you like what you see here and want to help me keep it going, please consider donating via the PayPal Contribute button below. https://www.erinsaudiocorner.com/contribute/
Last edited: