of course, just as hearing includes sight, in these cases...Aesthetics don't include ears?

-
WANTED: Happy members who like to discuss audio and other topics related to our interest. Desire to learn and share knowledge of science required. There are many reviews of audio hardware and expert members to help answer your questions. Click here to have your audio equipment measured for free!
You are using an out of date browser. It may not display this or other websites correctly.
You should upgrade or use an alternative browser.
You should upgrade or use an alternative browser.
Ascend Sierra-1 V2 Speaker Review
- Thread starter amirm
- Start date
That would depend if you allowed sight to interfere....of course, just as hearing includes sight, in these cases...
- Joined
- Dec 9, 2020
- Messages
- 376
- Likes
- 750
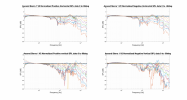
Ah, that measurement is taken that close, that clears up this mystery then. Technically I would consider this as off-axis, since there is a point in the nearfield where both drivers align. From my experience, non horn mounted tweeters need a little (50-100μs) delay to sum with woofers at a point of equal distance, so a passive design would have its on-axis/point of perfect summation shifted downwards, towards the woofer when getting this close.It is because for these transfer function measurements, Amir tests the speaker at only 1/3 meter and then normalizes to 1 meter. This is necessary because these are not Anechoic measurements so to reduce the influence of the room, these tests must be done at the rather extreme nearfield position. At only 1/3 meter (13 inches), the response of the woofer and tweeter do not fully blend together yet, thus that dip you see.
Klippel now offers a way around this using their ISC module (In-Situ Compensation). Basically, this module calculates the room response based on the full multi-hour long scan. The user can then remove the room response from the non-anechoic transfer function response (which is used to generate the THD, CSD, and compression measurements shown by Amir). ISC now works quite well and will allow true 1 meter transfer function measurements with essentially no influcence from the room. At 1 meter, that dip you mentioned would not be there.
It would be difficult for Amir to start using ISC and take these transfer function measurements at 1 meter compared to what he has been doing because if could invalidate comparisons from pre-ISC usage to post-ISC usage.
Hope this makes sense.
Do you happen to know if ISC is just a normalization process or if more complex computing goes into this process?
I'm not sure if I agree with your point about Amir's difficulties to switch to ISC. He has only started publishing linearity/compression data very recently (for three speakers now I think?) so it doesn't make much of a difference, if the switch happens soon. This is a relative plot anyways and I think it should be normalized to the reference response in the first place, so either way I don't think the presentation of this metric in particular is ideal. Neither do I think the current display of the waterfall plot is very useful if you want to compare speakers. This too would have to be normalized to the frequency response for an accurate judgement and I'm not sure if the ISC will also allow to normalize waterfalls to the frequency response. Amir said this is not possible in the Klippel software, which I find quite disappointing. It's an essential feature imo.
OP
- Thread Starter
- #44
It uses the computed complex impulse response of the anechoic measurements and applies that to the in-room one.Do you happen to know if ISC is just a normalization process or if more complex computing goes into this process?
OP
- Thread Starter
- #45
The responses are taken from distortion measurement graphs. They are not separate measurements. I actually started by using ISC for distortion measurements but didn't find it making meaningful difference so stopped doing that.I'm not sure if I agree with your point about Amir's difficulties to switch to ISC. He has only started publishing linearity/compression data very recently (for three speakers now I think?) so it doesn't make much of a difference, if the switch happens soon.
beagleman
Major Contributor
Honestly loved seeing this review!
I too first thought, "Another?"
But I find another view actually helps and explains things differently. There is enough differentiation to make this quite worthwhile.
A pleasant surprise.
The distortion graphs alone make it worth the price of admission, and add another layer to the knowledge.
Good Job!
MSRP is $998 per pair, 2 of the 4 finishes are available for $948 per pair.costs US $1,648 for a pair ($984 on sale).
Somehow I don't think people who work on audio products - especially speakers - as their full-time job forget about sound or listening to their products.forgetting about the most important - sound,
Well, yes and no. A tree falling in the forest with nobody to hear, etc. But then again, we know from a decent body of scientific work that measurements of audio and perceived sound are often strongly, sometimes almost perfectly correlated.something which is purely subjective
Agree there, of course.and it's what it's about in this hobby
Let's not forget that this is under $1K per PAIR. 15-20 years ago you could hardly find measurements this good for 10x that. Sometimes speakers that measure bad sound good. But the reverse is rarely true. Ascend is doing something special.
Are people really going to start saying "oh, you made the frequency response too even" without coming up with alternatives they'd prefer to hear or exactly why that's a problem? This speaker takes EQ well ... making it more or less suitable for anyone with access to EQ. If the FR is too even for you, by all means fix it.
If you'd prefer a speaker with a different frequency response or dispersion... that's totally valid. I'm not here to tell anyone what they should enjoy. But showing concern because a company is using the best tools available to get a certain result seems nonsensical to me. We should prefer that they aim and shoot in the dark instead?
Last edited:
Flexecutioner
Member
- Joined
- Nov 3, 2021
- Messages
- 53
- Likes
- 60
@amirm The price edit is still off. The Sierra-1 V2 is usually $998 (on sale for $948). The $1648 price listed is for a completely different speaker in the Ascend lineup.
 ascendacoustics.com
SIERRA-1 V2 PAIR
Our World-Renowned Reference Monitor, Now Even Better! "Innovation, performance, intensive quality controls and environmental-friendliness all precisely balanced in a truly unique loudspeaker." Our new Sierra-1 V2 is a complete reimagining of our true classic, the Sierra-1. It fully represents...
One notable benefit that Ascend offers is they sell upgrade kits for owners who've had previous Ascend speakers but wish to upgrade to the newer NFS optimized versions. I had the original Sierra 2 and have since upgraded them to the Sierra 2 EX v2, essentially keeping the cabinet and RAAL tweeter and replacing the woofer and crossover. I could've gotten different kits and change my speaker to the Sierra LX or the Sierra 1 v2 if I wanted to as well. You are also able to buy kits for their tower speakers, upgrading them to any newer variation you wish.
- Joined
- Dec 9, 2020
- Messages
- 376
- Likes
- 750
The more the nearfield response deviates from the computed farfield response, the more difference this will make. Since you show normalized distortion (which is good), regions with dips that don't show in the farfield response will show elevated distortion in theory. For this speaker for example, the 3-4KHz region had to be normalized 'up' by 5-6dB, so distortion would appear higher by that amount. The Sierra has really low distortion in that region in general and a 5dB change in distortion levels at these low levels will barely register on the your normalized graphs, since you have a linear Y-axis, so this isn't an example that illustrates the point, but I would generally suggest using ISC for those, to avoid said problem. Looking back at the measurements, the difference in level at 50Hz is 5dB between the computed farfield on the NF. I think that's a significant difference, especially for a small bookshelf like this. This makes the normalization pull up distortions at that frequency by 5dB more than it should, which could make the difference between 'distortion looking okay-ish' and 'distortion going off the charts'.The responses are taken from distortion measurement graphs. They are not separate measurements. I actually started by using ISC for distortion measurements but didn't find it making meaningful difference so stopped doing that.
Does it cost a lot of computing time to enable ISC? Or are there any other drawbacks documented by Klippel?
I have a ton of respect for Dave and Ascend Acoustics, especially his response to purchase a Klippel to improve all of his designs (a very large expense for a smaller independent manufacturer). A few years ago, after in-home auditioning, I went with Revel Performa3s instead of the pre-NFS optimized Ascend Sierra models, but the Ascends sounded very good and Dave was a complete gentleman to deal with. The fact that he has gone ahead and made improvements to all the Sierra models using the Klippel makes me wonder if I would make the same choice again.
Maiky76
Senior Member
Here is my take on the EQ.
Please report your findings, positive or negative!
For the score rational your journey starts here
Explanation for the sub score
The following EQs are “anechoic” EQs to get the speaker right before room integration.
If you able to implement these EQs you must add EQ at LF for room integration, that is usually not optional… see hints there.
The raw data with corrected ER and PIR:
Score no EQ: 6.1
With Sub: 7.5
Spinorama with no EQ:

Directivity:
Better stay at tweeter height
Horizontally, better toe-in the speakers by 10/15deg and have the axis crossing in front of the listening location, might help dosing the upper range.


EQ design:
I have generated two EQs. The APO config files are attached.
with sub: 8.0
Score EQ Score: 6.4
with sub: 8.3

Spinorama EQ LW

Spinorama EQ Score

Zoom PIR-LW-ON

Regression - Tonal

Radar no EQ vs EQ score
No improvements?

The rest of the plots is attached.
Please report your findings, positive or negative!
For the score rational your journey starts here
Explanation for the sub score
The following EQs are “anechoic” EQs to get the speaker right before room integration.
If you able to implement these EQs you must add EQ at LF for room integration, that is usually not optional… see hints there.
The raw data with corrected ER and PIR:
Score no EQ: 6.1
With Sub: 7.5
Spinorama with no EQ:
- Great effort
- Probably does not need EQ
- Directivity could be improved
Directivity:
Better stay at tweeter height
Horizontally, better toe-in the speakers by 10/15deg and have the axis crossing in front of the listening location, might help dosing the upper range.
EQ design:
I have generated two EQs. The APO config files are attached.
- The first one, labelled, LW is targeted at making the LW flat
- The second, labelled Score, starts with the first one and adds the score as an optimization variable.
- The EQs are designed in the context of regular stereo use i.e. domestic environment, no warranty is provided for a near field use in a studio environment although the LW might be better suited for this purpose.
with sub: 8.0
Score EQ Score: 6.4
with sub: 8.3
Code:
Ascend Sierra 1 V2 APO EQ LW 96000Hz
March292024-112255

Preamp: -2.9 dB

Filter 1: ON HPQ Fc 48.28,    0.00,    1.73
Filter 2: ON PK Fc 75.80,    -3.64,    1.00
Filter 3: ON PK Fc 398.12,    -1.34,    4.95
Filter 4: ON PK Fc 1346.53,    -1.61,    2.00
Filter 5: ON PK Fc 725.71,    -1.54,    4.97
Filter 6: ON PK Fc 4162.87,    1.37,    1.02

Ascend Sierra 1 V2 APO EQ Score 96000Hz
March292024-112255

Preamp: -2.9 dB

Filter 1: ON HPQ Fc 48.28,    0.00,    1.73
Filter 2: ON PK Fc 76.30,    -3.64,    1.00
Filter 3: ON PK Fc 408.19,    -1.50,    4.12
Filter 4: ON PK Fc 1556.68,    -1.29,    0.79
Filter 5: ON PK Fc 721.71,    -1.54,    4.97
Filter 6: ON PK Fc 3063.55,    1.37,    2.76
Filter 7: ON PK Fc 7620.61,    -0.86,    2.97
Spinorama EQ LW
Spinorama EQ Score
Zoom PIR-LW-ON
Regression - Tonal
Radar no EQ vs EQ score
No improvements?
The rest of the plots is attached.
Attachments
-
Ascend Sierra 1 V2 APO EQ LW 96000Hz.txt343 bytes · Views: 14
-
Ascend Sierra 1 V2 APO EQ Score 96000Hz.txt392 bytes · Views: 11
-
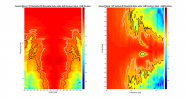 Ascend Sierra 1 V2 2D surface Directivity Contour Data.png244.2 KB · Views: 17
 -
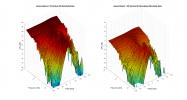 Ascend Sierra 1 V2 3D surface Vertical Directivity Data.png398.5 KB · Views: 17
 -
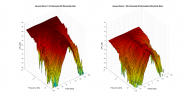 Ascend Sierra 1 V2 3D surface Horizontal Directivity Data.png379.2 KB · Views: 20
 -
 Ascend Sierra 1 V2 Normalized Directivity data.png477.7 KB · Views: 14
 -
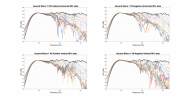 Ascend Sierra 1 V2 Raw Directivity data.png696.9 KB · Views: 17
 -
 Ascend Sierra 1 V2 Reflexion data.png298.8 KB · Views: 16
Last edited:
Not only that. Dave measure every single speaker after assembling and you get them inside your speaker shipping box.I just saw that. Great! Life would be simple if every manufacturer did. Thank you
More evidence that your work here is bearing fruit. This response from the Owner to start using Near-field measurement data to drive better performance of his products is the fruit ripening from the seeds you planted. Thanks for this fantastic review and thank you for creating this Science based Community where we can come and get the facts as they relate to the measured and verified performance of Audio Products. Cutting through the BullS-it marketing brainwashing and brand loyality mentality.See the "NFS Optimized" tag! A couple of years ago I tested an Ascend speaker and found the performance wanting. Needless to say, the company owner/designer, Dave, was not happy. But instead of taking his anger on me, he reached out to Klippel to learn more about the Near-field Scanner I had used to test his speaker. He quickly ordered one and started to revamp his speaker designs. We have seen an example of this in electronics area and benefits it brings to the company and its buyers. Such is happening here in speaker design.
Keep up the valuable work and keep pulling the curtain back to peer inside to reveal the actual value of what we are looking to spend our hard earned money on. You make it pretty easy to sing your praises when we read a product review that is directly connected to a previous review where the product performance demonstrates measurable and meaningful improvements. This didn’t happen by accident. Bravo Zulu Boss!

@AscendDFIs Dave on this forum? What is his tag
Dave is not here to mess around. He is not here to play. He is here to take care of business.
And business he took care of.
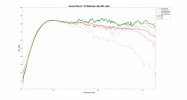
@AscendDF do you have a wider bandwidth plot that can show 'oil can resonance' of the metal tweeter?
Where does it occur?
Before the ASR fans jump and scream about audibility - duh.
JA at Stereophile has been showing this for years in his measurements and it always made me curious.
Some designers push it higher above 20kHz than others, with choice of driver and/or damping etc
Where does it occur?
Before the ASR fans jump and scream about audibility - duh.
JA at Stereophile has been showing this for years in his measurements and it always made me curious.
Some designers push it higher above 20kHz than others, with choice of driver and/or damping etc
@AscendDF do you have a wider bandwidth plot that can show 'oil can resonance' of the metal tweeter?
Where does it occur?
Before the ASR fans jump and scream about audibility - duh.
JA at Stereophile has been showing this for years in his measurements and it always made me curious.
Some designers push it higher above 20kHz than others, with choice of driver and/or damping etc
It's this tweeter: https://www.madisoundspeakerstore.c...tac/gb-h1825-aluminum/magnesium-dome-tweeter/
Also here: https://www.seas.no/index.php?optio...gb&catid=45:seas-prestige-tweeters&Itemid=462
The resonance appears to be around 25kHz.
Similar threads
- Replies
- 232
- Views
- 33K
- Replies
- 29
- Views
- 4K
- Replies
- 313
- Views
- 61K
- Replies
- 0
- Views
- 659
- Replies
- 234
- Views
- 35K