
Maiky76
Senior Member
Hi,
After analyzing the results produced by the Adam T8V https://www.audiosciencereview.com/forum/index.php?threads/adam-t8v-studio-monitor-review.17118/page-3#post-553687 I was curious about the T7V.
@amirm hasn’t measured it yet (but it on the errands list, I believe) but Audioholics did and provided graphs that I digitized and subsequently used to design some EQs as per usual.
Adam T7V, 250USD/unit street price
Review from Audioholics
https://www.audioholics.com/bookshelf-speaker-reviews/adam-audio-t7v
An other data point can be found on their own website.
https://www.adam-audio.com/content/...dio-monitor-review-sound-and-recording-en.pdf
It seems to bode well with the synthesized curve I came up up with with broadly the same features.
The scanned data can be accurate to +/-0.15 (in terms of score) see there:
https://www.audiosciencereview.com/...anovic-rtm10-monitor.16905/page-4#post-557012
But it can also deviate more (more on that latter)...
When the NFS data is available I will be able to check what a I do compared to the real thing.
In particular the resolution below 1000Hz might be too coarse because of the windowing technics used and consequently the peaks/deeps in that range might be underestimated.
No information is available regarding linearity.
The Spinorama data of the speakers is attached for whom it may be useful, unzip it.
Notes on the limits of the exercise:
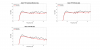
Here is the synthesized Adam T7V Spinorama with no EQ,
score 4.51; with sub: 6.70
The frequency response looks rather ragged and uneven but not too dissimilar to the JBL 305p MKII.
I wish that the the range under 1000Hz was smoother thought.
The ERDI looks very smooth which is great for media use.
The SPDI looks like the speaker will respond to the EQ well. Spoiler, it did indeed…

EQ design
I have generated two EQs. The APO config files are attached.
This is the only deviation from the flat seed.
Score EQ: 6.89; with sub: 9.08 (!)
Score EQ OTT: 7.11; with sub: 9.17 (!)

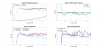
Spinorama EQ

Spinorama EQ OTT

Zoom PIR-LW-ON

Regression - Tonal flat after EQ

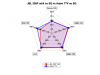
Radar: a lot of efforts for the EQ but big pay off!

Here is the comparison with the JBL 305p mkII, EQ published there:
https://www.audiosciencereview.com/...pro-monitors-review.10811/page-29#post-547172
The LF driver size is different but I thought it could be of some interest for some. It was for me at least.
Out-of-the-box the tuning looks similar. Is there cross pollination going on or is this an optimal response curve?
The JBL looks smoother

With a similar EQ complexity:

The OTT EQ on the Adam
I am curious to know how the differences in the PIR translate during a listening test.

I can’t say that the out-of-the-box performance is what I consider state-of-the-art, some monitors measure better without any EQ (Kali LP8 as an example), but if the EQed version lives up to the number that could be a great buy. So better than the JBL? not sure but a good reference point.
For those interested there is also some data available for some other 8inch monitors:
Kali LP8 vs Presonus Eris E8 XT, Spinorama and EQ design inside
After analyzing the results produced by the Adam T8V https://www.audiosciencereview.com/forum/index.php?threads/adam-t8v-studio-monitor-review.17118/page-3#post-553687 I was curious about the T7V.
@amirm hasn’t measured it yet (but it on the errands list, I believe) but Audioholics did and provided graphs that I digitized and subsequently used to design some EQs as per usual.
Adam T7V, 250USD/unit street price
Review from Audioholics
https://www.audioholics.com/bookshelf-speaker-reviews/adam-audio-t7v
An other data point can be found on their own website.
https://www.adam-audio.com/content/...dio-monitor-review-sound-and-recording-en.pdf
It seems to bode well with the synthesized curve I came up up with with broadly the same features.
The scanned data can be accurate to +/-0.15 (in terms of score) see there:
https://www.audiosciencereview.com/...anovic-rtm10-monitor.16905/page-4#post-557012
But it can also deviate more (more on that latter)...
When the NFS data is available I will be able to check what a I do compared to the real thing.
In particular the resolution below 1000Hz might be too coarse because of the windowing technics used and consequently the peaks/deeps in that range might be underestimated.
No information is available regarding linearity.
The Spinorama data of the speakers is attached for whom it may be useful, unzip it.
Notes on the limits of the exercise:
- I have spliced the LF of the ON to the other curves and simulated the directivity, so it's probably not perfect but, I hope, a reasonable approximation. TBC
- The scores are only indicative as the resolution of the scans, although interpolated to a correct 1/20th octave step, is most probably too coarse, especially since we have no information regarding the calculation of the ER which may or may not be off like for the NFS’.
- The calculated scores are not directly comparable to the others form ASR but I would be inclined to say that the EQ benefits are correctly captured
- The EQs are designed in the context of regular stereo use i.e. domestic environment, no warranty is provided for a near field use in a studio environment.
Here is the synthesized Adam T7V Spinorama with no EQ,
score 4.51; with sub: 6.70
The frequency response looks rather ragged and uneven but not too dissimilar to the JBL 305p MKII.
I wish that the the range under 1000Hz was smoother thought.
The ERDI looks very smooth which is great for media use.
The SPDI looks like the speaker will respond to the EQ well. Spoiler, it did indeed…
EQ design
I have generated two EQs. The APO config files are attached.
- The first one would be similar to what I would usually do without over doing things. Similar number of biquads I used for the JBL 305p mkII that I used as a reference.
- The second one is a bit Over-The-Top (OTT) as it was tantalizing close to break the 7/9 mark. Adam themselves provide a 2dB boost at LF so why not…
This is the only deviation from the flat seed.
Score EQ: 6.89; with sub: 9.08 (!)
Score EQ OTT: 7.11; with sub: 9.17 (!)
Code:
Adam T7V APO EQ 96000Hz
November052020-122728

Preamp: -0.7 dB

Filter 1: ON PK Fc 89 Hz Gain -2.85 dB Q 1.41
Filter 2: ON PK Fc 521 Hz Gain -2.28 dB Q 7
Filter 3: ON PK Fc 669 Hz Gain 1.66 dB Q 2.48
Filter 4: ON PK Fc 776 Hz Gain -3.29 dB Q 6
Filter 5: ON PK Fc 1216 Hz Gain -1.85 dB Q 9.99
Filter 6: ON PK Fc 1837 Hz Gain -2.87 dB Q 2.39
Filter 7: ON PK Fc 3266 Hz Gain -2.25 dB Q 3.47
Filter 8: ON PK Fc 3994 Hz Gain 1.75 dB Q 8.25
Filter 9: ON PK Fc 6335 Hz Gain -1.5 dB Q 3.25
Filter 10: ON PK Fc 8371 Hz Gain -2.36 dB Q 0.91

Adam T7V APO EQ OTT 96000Hz
November052020-122829

Preamp: -1.3 dB

Filter 1: ON PK Fc 46 Hz Gain 2 dB Q 1.66
Filter 2: ON PK Fc 87 Hz Gain -3.23 dB Q 1.41
Filter 3: ON PK Fc 520 Hz Gain -2.4 dB Q 7
Filter 4: ON PK Fc 668 Hz Gain 1.71 dB Q 2.48
Filter 5: ON PK Fc 777 Hz Gain -3.29 dB Q 6.08
Filter 6: ON PK Fc 1216 Hz Gain -1.85 dB Q 9.99
Filter 7: ON PK Fc 1837 Hz Gain -2.87 dB Q 2.39
Filter 8: ON PK Fc 3278 Hz Gain -2.17 dB Q 3.47
Filter 9: ON PK Fc 3990 Hz Gain 1.77 dB Q 7.61
Filter 10: ON PK Fc 6317 Hz Gain -1.7 dB Q 3.25
Filter 11: ON PK Fc 9808 Hz Gain -2.34 dB Q 0.67
Filter 12: ON PK Fc 12135 Hz Gain 1.48 dB Q 4.59
Filter 13: ON PK Fc 17731 Hz Gain -1.1 dB Q 3.09
Spinorama EQ
Spinorama EQ OTT
Zoom PIR-LW-ON
Regression - Tonal flat after EQ
Radar: a lot of efforts for the EQ but big pay off!
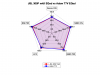
Here is the comparison with the JBL 305p mkII, EQ published there:
https://www.audiosciencereview.com/...pro-monitors-review.10811/page-29#post-547172
The LF driver size is different but I thought it could be of some interest for some. It was for me at least.
Out-of-the-box the tuning looks similar. Is there cross pollination going on or is this an optimal response curve?
The JBL looks smoother
With a similar EQ complexity:
The OTT EQ on the Adam
I am curious to know how the differences in the PIR translate during a listening test.
I can’t say that the out-of-the-box performance is what I consider state-of-the-art, some monitors measure better without any EQ (Kali LP8 as an example), but if the EQed version lives up to the number that could be a great buy. So better than the JBL? not sure but a good reference point.
For those interested there is also some data available for some other 8inch monitors:
Kali LP8 vs Presonus Eris E8 XT, Spinorama and EQ design inside
Attachments
-
Adam T7V APO EQ OTT 96000Hz.txt678 bytes · Views: 272
-
Adam T7V APO EQ 96000Hz.txt531 bytes · Views: 208
-
 Adam T7V Zoom PIR-LW-ON.png110.3 KB · Views: 3,035
 -
 Adam T7V EQ design.png219.4 KB · Views: 1,109
 -
Adam T7V Spinorama.zip28.2 KB · Views: 140
-
 Adam T7V no EQ vs JBL 305p mkII no EQ radar.png68.8 KB · Views: 237
 -
 Adam T7V EQed OTT vs JBL 305p mkII EQed radar.png72.4 KB · Views: 201
 -
 Adam T7V EQed vs JBL 305p mkII EQed radar.png71.1 KB · Views: 403
Last edited:

")