And from my end, it's always interesting to see a variety of measurements from which to glean some useful technical points. Thanks for sharing your results.
")
I'm not entirely convinced that the membrane vibration modes in the U18 that you refer to are going to be all that audible. One has to be very careful in drawing any such conclusions, as there are a lot of effects at play.
Yes we have to be careful with the link measurement/conclusion.
But as I'm convinced about what I'm "claim", I just try to share my humble experience with arguments.
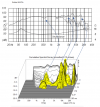
I can see that bump in the impedance. However, it needs to be kept in mind that it is quite small in magnitude and relatively broad. That to me indicates a low-Q resonance of some kind, and that means that it will be quickly damped out. In fact, upon looking more closely, that bump in the impedance more or less corresponds to a small broad dip in the frequency response over the frequency range from 600Hz o 1000Hz.
There are a lot of interesting things to see with the impedance plot.
The little bump on the impedance plot,
linked with the CSD (U18), indicates that the whole membrane can not longer follow the magnetic coil of the driver.
Little illustration:
These fragmentation/resonances create specific sound as a "signature" related to the materiel used for the membrane.
If I crumple a sheet of paper, I recognize its sound.
Same for a aluminum foil.
When playing a L18 without any XO, that sounds "crispy" roughly speaking like an aluminum foil we crumple.
But the difference L18/U18 (I'm considering to be in a two ways setting here) : we can manage to cut the L18 far under its membrane breakup, while we are obliged to let the U18 working in a frequency range where its membrane "crumples".
*About a driver like the L18, I've personally chosen to get a frequency cut under the breakup frequency divided by three in order to limit the excitation of the breakup by the H3.
In addition, although the finger has been pointed at the bump in the impedance in the U18 driver, I see no impedance bumps for the L18 driver in the region where those extreme peaks and dips are occurring in the 6kHz to 20kHz band. Those significant breakup modes appear to leave no trace of themselves on the impedance curve.
Difficult to see on the manufacturer plot you're right. Here is better.
Keep in mind that the aluminum cone of the woofer can act as vibrating surface that is excited by soundwaves that impinge on it. Those high-frequency high-Q relatively undamped cone resonances will ring like a bell when excited by reflected high-frequency energy that was originally emanated by the tweeter in their frequency range, and which comes back to hit the woofer cone, no doubt adding "air" and "sparkle" to the music reproduction. Those resonances should be avoided at all costs in a driver destined for use in a loudspeaker system attempting to do well at high-fidelity sound reproduction. There are other, better options available.
Overall I agree. But any speaker design have compromises.
The membrane breakup can be exited, by a tweeter (to a lesser extent), but above all by the intrinsically harmonic distortion created by the motor.
It's difficult to fully avoid the membrane breakup. But we can still get something clean:
*Not L18 here but L16
Although it is possible to be inclined to ascribe the slow decay in the CSD plot in the 1kHz region to that impedance bump, I'm not convinced that they are linked. If you also revisit the CSD plot for the L18, there is a very similar slow decay in the 1kHz region, which is somewhat masked by the extremely high amplitude high-frequency breakup modes of the aluminum cone, whose material unfortunately has a loss factor that is very, very low.
I should have add a 5dB scale for the L18 in order to compensate the high amplitude of the breakup.
But we still see that the behavior difference is very important between these two drivers.
Below new charts limited to 5kHz.
I know the driver I prefer to work with.
This brings me back to the point that I tried to make earlier, that the frequency response plot generally contains all the required information (for what should in fact be a relatively linear device), and it is also much easier to interpret as well.
Frequency response is only the first spline (at 0ms) of the CSD.
CSD contains many more information than "a simple" frequency response plot.
We are now getting into the subjective realm where one person's "muffled" and "felted" is another's "natural" and "non-fatiguing". In the end, those old and learned BBC engineers worked hard to remove resonances from loudspeaker driver diaphragms. They knew that they should not to be present in an ideal driver.
For me, an ideal driver don't exists, only compromises as I said upper.
Knowing that, my point of view is that the over value of a designer is to take in considerations all parameters and measurements, interprets them without excluding a measurement if the interpretation is difficult or if the result does not respond to its expectation. The most difficult things is to success to make correlation between the measurements and the subjective realm.
It's a pity that the BBC's extensive body of fundamental research work appears to be easily discounted for some unknown reason.
I really have trouble finding a connection between this discussion and this sentence.
Anyway very interesting exchange, thank to have replied with argumentation.