• WANTED: Happy members who like to discuss audio and other topics related to our interest. Desire to learn and share knowledge of science required. There are many reviews of audio hardware and expert members to help answer your questions. Click here to have your audio equipment measured for free!

Measuring Some Vintage Speakers

Juhazi

Major Contributor
Joined
Sep 15, 2018
Messages
1,725
Likes
2,912
Location
Finland
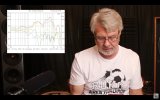
About reflections and room modes... One can "see" modes easily from REW wavelet spectrogram. Second is waterfall with default settings and third is raw impulse. In impulse wiev you cannot see the frequency, only timing and magnitude of reflections.

Below bconline's measurement of Revel ant 100cm - pretty clean! My 150cm and spot measurements tell how different they are actually.

Revel F206 comp.jpg


ainogradient 150cm comp.jpg ainogradient spot comp.jpg
 
Last edited:

Rick Sykora

Major Contributor
Forum Donor
Joined
Jan 14, 2020
Messages
3,633
Likes
7,378
Location
Stow, Ohio USA
Thanks! I really appreciate the suggestions. I'm thinking I may do this outdoors next time. It's all fun for me!

You are welcome. One good way to debug your test rig is to compare to a known baseline. In this case, the NRC had tested the Revel F206 (see here), so below is how your FR measurement compares...

1711970829587.png


The green trace is the NRC baseline, and the blue is your posted data. To match conditions as best as possible, I removed your smoothing and applied an 11 msec gate to make your data more like the NRC anechoic conditions. The first aspect is the gating cuts off your measurements below 100 Hz as the data below that is skewed due to your test environment. The second aspect you notice is your measurement resolution has much more variance. Some of this is partly due to the lower resolution of your gear...

Yes, looks as though there is other major work to do too. Ofc, the first major constraint here is whether your F206 and the NRC one is well matched or not. They may not be, but there are some obvious takeaways. The level diff is the most obvious one and as mentioned earlier is a matter of needing to do SPL calibration in REW. The dip around 2800 Hz is narrow and may be due to a test stand reflection. As timing is critical to better measurements, if your soundcard cannot do a loopback, consider using an acoustic timing reference. Unless your soundcard is really good and you want to intend to do this seriously, suggest replacing it with one of the recommended audio interfaces (Motu M2 or equiv is around $200).

Finally, it seems low risk, but really need to determine whether your older amp may introduce issues. Since you do not need much power to test speakers, an inexpensive Class D amp may be worthwhile too. If you try most of the other improvements and still cannot align well with a known baseline, swap out the amp. In that regard, am attaching the F206 baseline so you can import to REW.
 

Attachments

  • Revel F206 SPL.txt
    18.3 KB · Views: 16
Last edited:

Juhazi

Major Contributor
Joined
Sep 15, 2018
Messages
1,725
Likes
2,912
Location
Finland
Smoothing of spl graph is very helpful. Most publised data use 1/12 or 1/6 octave smoothing. But 1/3 or 1/2 oct match best with listening impression

Gating time makes a difference, look at my pics here.
Frequency-dependent windowing FDW removes some artefacts. Here 15 cycles which seems to be REW's default, now with basic 60ms right window.

F206 spl 3,5ms - 60ms - tile.jpg
 

DanielT

Major Contributor
Joined
Oct 10, 2020
Messages
4,851
Likes
4,805
Location
Sweden - Слава Україні
That's just directivity, not dispersion or other beam-bending phenomena. Dispersion has different meanings, but in the context of wave propagation it's where group velocity is a function of frequency, and gives rise to refraction. However HiFi folk seem to have adopted it to mean directivity, which I don't think OldHvyMec was really talking about.
What you say has a point.

Even Genelec mixes up the concepts. Under the Directivity Control Waveguide (DCW™) Technology tab it says:

The DCW technology shapes the emitted wavefront in a controlled way, allowing predictable tailoring of the directivity (dispersion) pattern.


Edit
Genelec of course knows what dispersion and directivity mean.
 
Last edited:

Juhazi

Major Contributor
Joined
Sep 15, 2018
Messages
1,725
Likes
2,912
Location
Finland
Link to NRC measurements of Revel F206 (2014) published in SoundStage


Measured at 2m, spl corrected to 1m distance

fr_on1530.gif

Top curve: on-axis response
Middle curve: 15 degrees off-axis response
Bottom curve: 30 degrees off-axis response


Other measurements in WWW
 
Last edited:

ThoFi

Active Member
Joined
Aug 15, 2021
Messages
224
Likes
75
Some measurements of my Harbeth SHL5+ 40th Anniversary. (2 different tube amps, 4 and 8Ohm tap)
One speaker put in the middle of my listening room, mic @ tweeter height, 1m distance.
UMIK mic and REW.

1711994889477.jpeg
 

dagfinn

Member
Joined
Apr 9, 2023
Messages
45
Likes
79
Thanks for publishign this.
Quite some work...


Looking at this one is interesting, IMO, since it shows immediately common "incidents" which are more likely due to room/position.
Like the peaks at 55Hz, 70Hz and 95Hz and the consequent dip around 85Hz.

This could be even more obvious if the plot levels were aligned on an average on, say, 1kHz-2kHz, as an example.

Manually normalized at 400Hz, it seemed natural...
1712005149335.png
 
OP
B

bconline

Member
Joined
Nov 29, 2023
Messages
48
Likes
647
In this case, the NRC had tested the Revel F206 (see here), so below is how your FR measurement compares...
Yuck! My measurement is pretty ugly compared to the NRC plot. Seems that I have a lot of room for improvement. I could try:
  • Measure at higher SPL
  • Measure outdoors
  • Instead of the Creative SoundBlaster X-Fi Surround 5.1 Pro, I could use a Topping DX3 Pro+ that I normally use in the Living Room system.
  • Check the amplifier - Seems like I may have a boost from 4Khz - 15Khz
  • Better microphone mount? I'm not sure what I should do differently.
  • 1712037566932.png
 
OP
B

bconline

Member
Joined
Nov 29, 2023
Messages
48
Likes
647
Bconline, if you feel up to it, I'd be curious to see the results anyway, so turn Mark Audio Alpair 10.2 upside down so the driver ends up close to the floor.
Then tilt it up just enough and take a measurement. Would be fun to compare that result with your original measurement.:)
I did something like that with a testbox when I was designing that speaker. I did one measurement with the speaker standing normally. Then I did a second measurement with the box on its side and the mic on ground plane. Here's the graphs, with laying down in blue. It does eliminate the 150hz dip.

1712044362186.png
 
Last edited:
OP
B

bconline

Member
Joined
Nov 29, 2023
Messages
48
Likes
647
Our friend Danny at GR Research just posted his measurements of the JBL 4311. Here's his chart versus mine, with the same parameters (6ms gate, 1/3 octave smoothing, 25db range, 200hz and up):

1712045252841.png
1712045370078.png


Decent correlation up to ~3khz ,then very different. One testing difference is that I measured on the tweeter axis and he says he measured somewhere between the three drivers.
 

DanielT

Major Contributor
Joined
Oct 10, 2020
Messages
4,851
Likes
4,805
Location
Sweden - Слава Україні
I did something like that with a testbox when I was designing that speaker. I did one measurement with the speaker standing normally. Then I did a second measurement with the box on its side and the mic on ground plane. Here's the graphs, with laying down in blue. It does eliminate the 150hz dip.

View attachment 360788

With the blue, easier to EQ. :) Another thing, however, is IF you want the speaker positioned that way when listening to music.:oops:

Our friend Danny at GR Research just posted his measurements of the JBL 4311. Here's his chart versus mine, with the same parameters (6ms gate, 1/3 octave smoothing, 25db range, 200hz and up):

View attachment 360793 View attachment 360795

Decent correlation up to ~3khz ,then very different. One testing difference is that I measured on the tweeter axis and he says he measured somewhere between the three drivers.
Interesting, such big differences in the higher frequencies that one can suspect that there may be something wrong with some of the tweeters being measured.

Flipping your or Danny's curve upside down at around 7 kHz it will look a bit similar, or remind each other for FR higher up in frequency. Weird.:oops:
(some similarity anyway)
 
Last edited:

Sokel

Master Contributor
Joined
Sep 8, 2021
Messages
6,210
Likes
6,331
On such driver configurations and shallow/overlapping slopes like the 4311 the measurement axis has a large influence so it could be either.
In such configurations we measure just below the lower surround of the woofer and above the mid-tweeter if I remember well.
But that may vary too by centimeters,one has to test.
 

Rick Sykora

Major Contributor
Forum Donor
Joined
Jan 14, 2020
Messages
3,633
Likes
7,378
Location
Stow, Ohio USA
Yuck! My measurement is pretty ugly compared to the NRC plot. Seems that I have a lot of room for improvement. I could try:
  • Measure at higher SPL
  • Measure outdoors

If you follow the REW setup instructions, you will cover the basics. On the SPL, if you do not have a dedicated meter, you can use a cellphone app to improve the setting. Outdoor measurements might be better if you are somewhere with lower ambient noise. You might try with your Revel and do a quick check to see if it improves or not. Unless you get higher than in your garage, your gate will not change. Might just try to elevate in your garage away from as many surfaces as possible.

  • Instead of the Creative SoundBlaster X-Fi Surround 5.1 Pro, I could use a Topping DX3 Pro+ that I normally use in the Living Room system.

The Topping might give you some reference but could be worse too. If you do the REW soundcard calibration, you will get some idea of how much the SoundBlaster is affecting the measurement. Where possible, ensure you use the exclusive device selections in REW. If your PC is sharing the soundcard, you can have measurements corrupted by notification events and other noises. If your notebook allows, set the system sound device to the notebook’s internal soundcard. Ensure all sound enhancement settings are turned off on the Soundblaster.

  • Check the amplifier - Seems like I may have a boost from 4Khz - 15Khz
  • Better microphone mount? I'm not sure what I should do differently.

These are lower priority but may be needed to get optimal results. Getting your computer behind the mic and everything as far away from reflective surfaces is the first step. Place the speaker close to the center of your garage and tweeter height halfway to ceiling. Avoid any smoothing until you get the basic gated measurements cleaned up. You will know if you improve if you can get the gate setting to be higher.
 

GDWL34

Member
Joined
Jan 17, 2021
Messages
35
Likes
70
This one is an MLTL that I built using the Mark Audio Alpair 10.2 full range driver. Remarkable bass from a 4.5" driver. However, the driver has a peak at ~8khz. The measurement also suffers from more floor/ceiling bounce problems due to the high mounted "woofer". I use this set daily with DSP to even out the in-room response.

View attachment 360225 View attachment 360226
looks like the Pearl Acoustics with almost same driver. They manage to get to 20.000....Frequency range: 38Hz-20Khz. (-6db occurs in most acoustically well-balanced listening rooms at around 36Hz)
 

mhardy6647

Grand Contributor
Joined
Dec 12, 2019
Messages
11,450
Likes
24,859
outdoors does (should) solve a lot of "problems" -- on the other hand, there's something (admittedly, I am not sure exactly what) to be said for measuring the behavior of a loudspeaker (ideally, two) in a real-world environment. The problem, of course, arises with reproducibility of the assessments by a third party.
That's a big deal in actual science, of course (ask, e.g., Fleischmann and Pons ;) ) -- probably much less so in the case of domestic loudspeakers.
My hope for all of the fancy testing that's been done here at ASR (e.g.) is that apples to apples comparisons of loudspeaker behavior will help schlubs like me glean what sort of quantitative behavior correlates well with the sound of loudspeakers that I like. In the final analysis, of course, it is all about me! ;)

A reasonable grasp of that should (or at least could) help me buy a loudspeaker without hearing it and have a good notion of whether I might like the way it sounds!

Id like a pony .jpg

;)
 

Rick Sykora

Major Contributor
Forum Donor
Joined
Jan 14, 2020
Messages
3,633
Likes
7,378
Location
Stow, Ohio USA
Agree on 3rd party reproducibility, but as not everyone will have many speakers, it becomes essential to be able to more readily compare measurements. Can dream and hope the manufacturers will get us there someday....

Knowing one's own test gear can allow for relative comparisons even if the accuracy is less than ideal. Publishing for public consumption requires better discipline or appropriate disclaimers. Otherwise, many incorrect assertions and conclusions can be made. When this happens too often, then trust in measurements breaks down and we are back to mucking around in the swamp of opinions and subjectivity. :eek:
 

DanielT

Major Contributor
Joined
Oct 10, 2020
Messages
4,851
Likes
4,805
Location
Sweden - Слава Україні
On such driver configurations and shallow/overlapping slopes like the 4311 the measurement axis has a large influence so it could be either.
Now I looked at Danny's video. Starting at 2:40, he explains that the tweeter didn't work so they had to fix a new one. See here , a graph where the tweeter is disconnected. You can see how high up in the frequency the mid driver plays. That, in combination with hardly any crossover with the new tweeter Danny put in, creates comb filter effect when the mids and tweeters play over each other. It must mean that the slightest change in the location of the microphone gives different results. Or so I guess it is.:)

Which, by the way, Danny mentions, that is, they really had to work a lot to find a sensible position with the microphone when they did the sweep with the new tweeter connected.

Edit:
Comb filter effect can be seen in Danny's off axis measurements, see attached pictures.

FR without tweeter:
Screenshot_2024-04-02_174619.jpg


Watch starting at 2:40 in Danny's video:


Attachments

  • Screenshot_2024-04-02_182059.jpg
    Screenshot_2024-04-02_182059.jpg
    617.5 KB · Views: 13
Last edited:
Top Bottom