No it was not. You claimed that your low frequency measurements of this bookshelf speaker will be more accurate than that of Klippel NFS. I can't let you create such FUD regarding accuracy of Klippel NFS while at the same time you are posting misleading measurement graphs. Watch what you say in these technical matters.None of that matters, your Klippel measurements were not accurate on that particular test. That was and is the ONLY point I was making.

-
WANTED: Happy members who like to discuss audio and other topics related to our interest. Desire to learn and share knowledge of science required. There are many reviews of audio hardware and expert members to help answer your questions. Click here to have your audio equipment measured for free!
You are using an out of date browser. It may not display this or other websites correctly.
You should upgrade or use an alternative browser.
You should upgrade or use an alternative browser.
March Audio Sointuva Speaker
- Thread starter March Audio
- Start date
- Status
- Not open for further replies.
OP
- Thread Starter
- #202
Oh touche, the ironyNo it was not. You claimed that your low frequency measurements of this bookshelf speaker will be more accurate than that of Klippel NFS. I can't let you create such FUD regarding accuracy of Klippel NFS while at the same time you are posting misleading measurement graphs. Watch what you say in these technical matters.
") Deja vu anyone?
Deja vu anyone?Please check "possibly" and the wink after the comments. So please calm down.
My graphs are not misleading.
Simple question.
Was your Klippel measurement of the Revel F328 accurate at low frequencies?
Yes or no?
I know you wont answer so for others reading the answer is no, it was not accurate.
https://www.audiosciencereview.com/forum/index.php?threads/revel-f328be-speaker-review.17443/
I really dont understand why you have gone on the attack on this.
*ALL* measurement methods have their issues and inaccuracies. The Klippel does too, it is not perfect. You need to acknowledge this fact instead of getting overly sensitive about it. Pretending otherwise is only misleading thing happening here.
I suggest you take a step back, have a cup of coffee, come back later and hopefully you will see it for what it is.
Last edited:
That is what is required for computation of Preference Score:@amirm why have you settled on 20 points not 24?
A Multiple Regression Model for Predicting
Loudspeaker Preference Using Objective
Measurements: Part II - Development of the Model
Sean E. Olive, AES Fellow
OP
- Thread Starter
- #204
Fair enough, its just that 1/24th is a more common, in fact universal setting.That is what is required for computation of Preference Score:
A Multiple Regression Model for Predicting
Loudspeaker Preference Using Objective
Measurements: Part II - Development of the Model
Sean E. Olive, AES Fellow
View attachment 95502
Last edited:
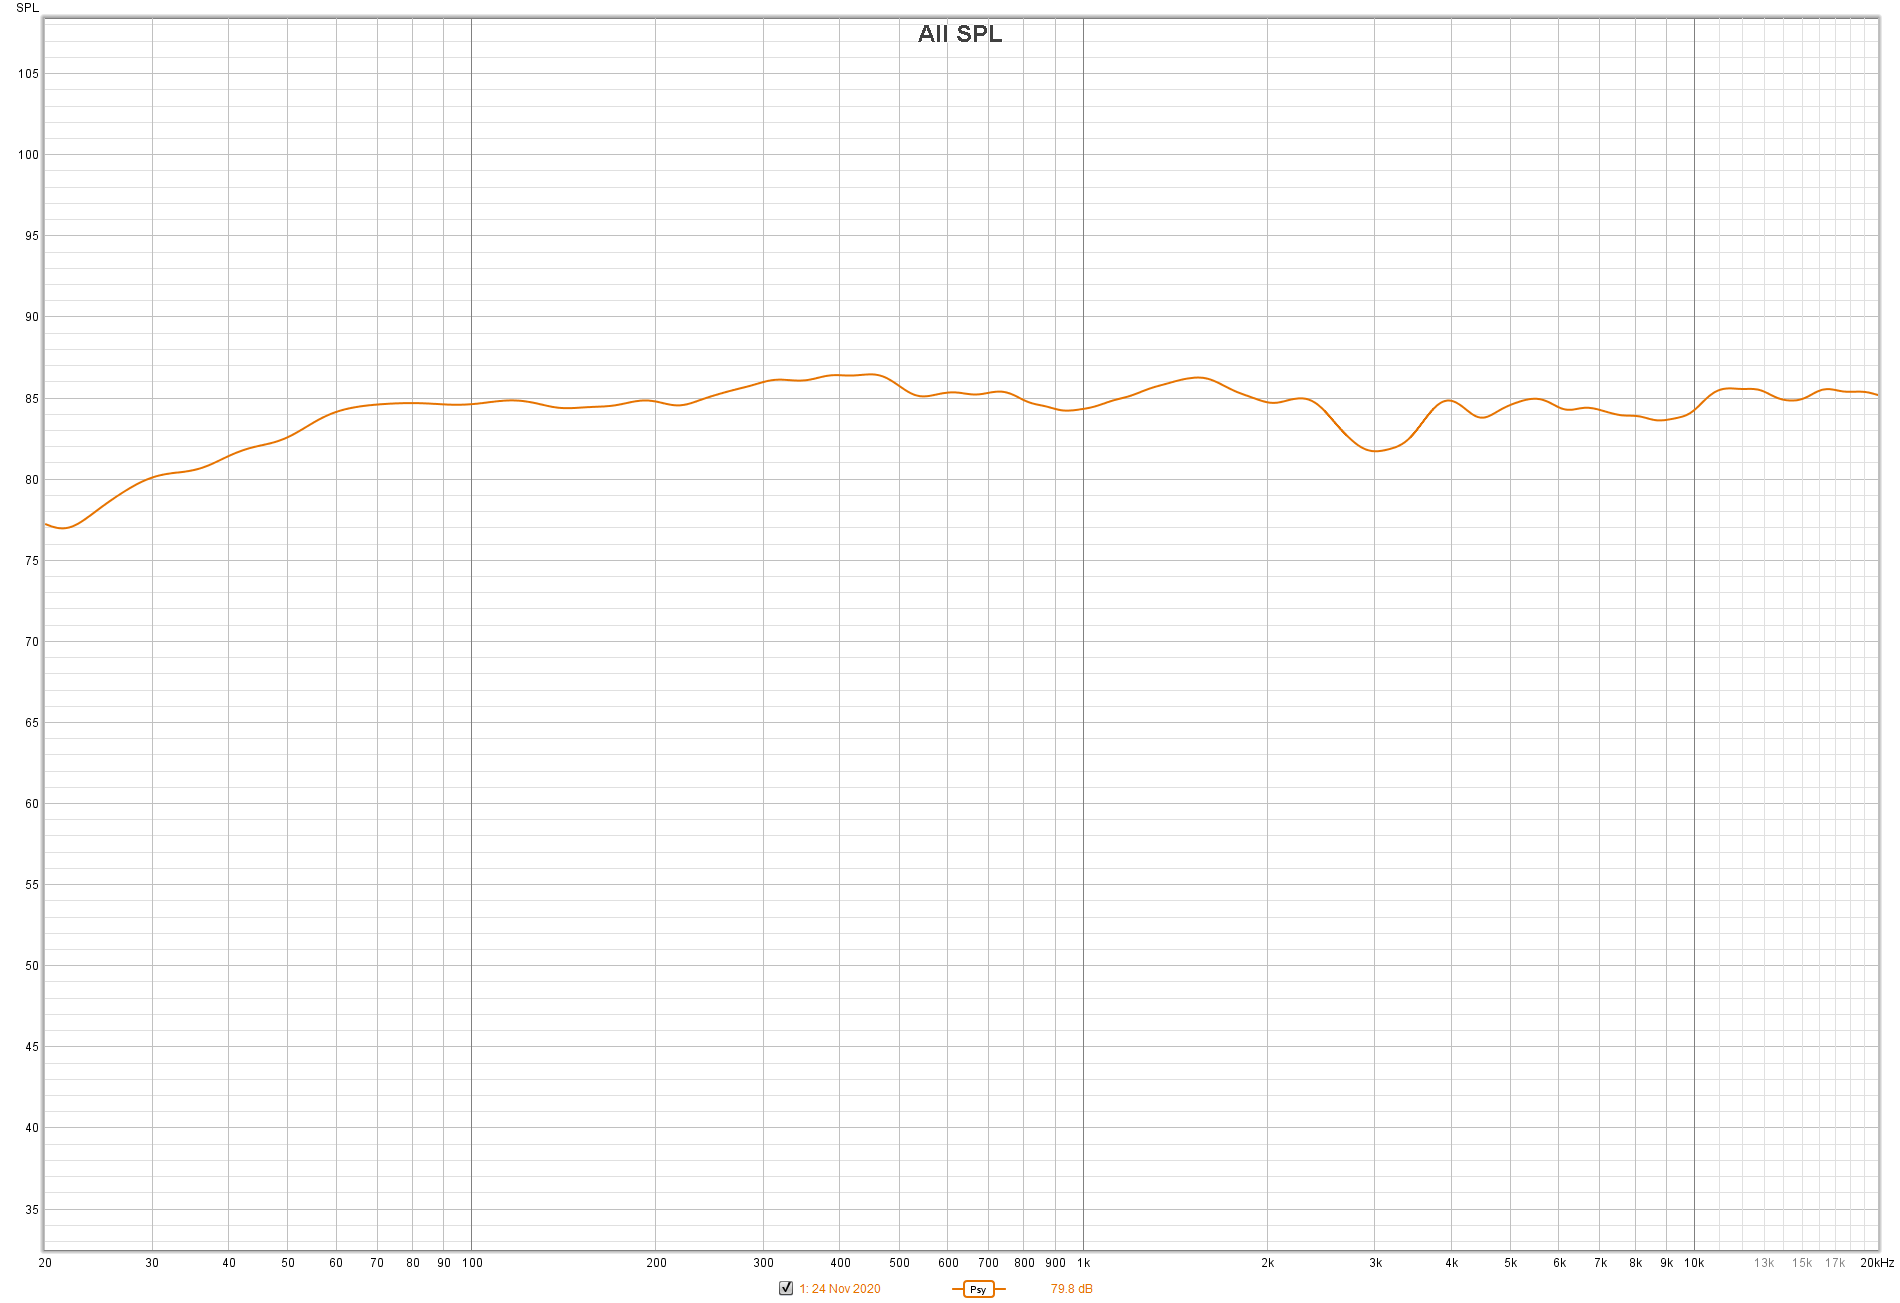
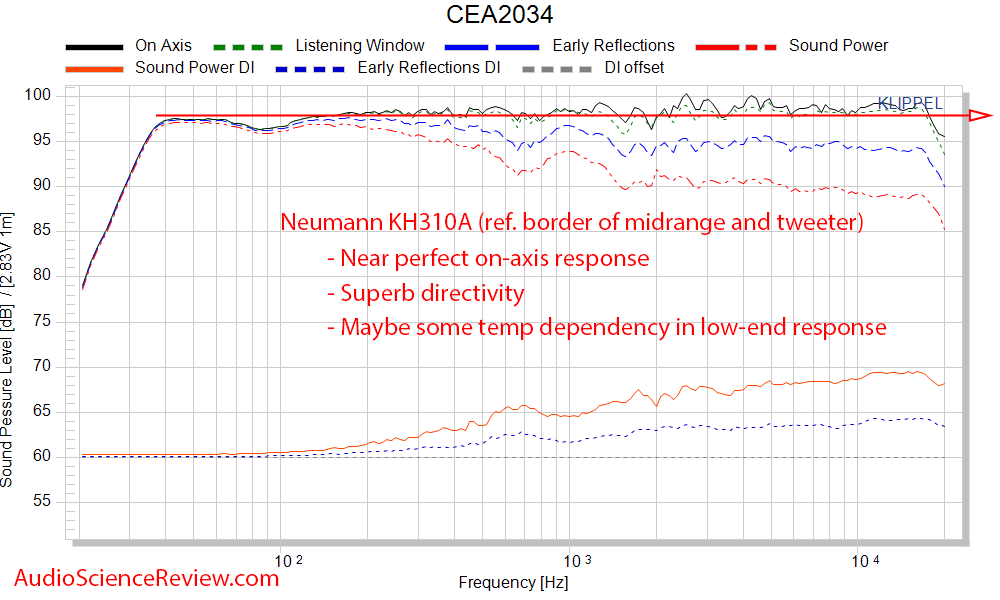
Of course they are and I have explained in detail. No measurement I have ever post looks like this:My graphs are not misleading.
This is what they look like from a very good monitor: Neumann KH310:
See the difference in clarity? How everything can be easily read. And how the on-axis graph has many ups and downs that yours above completely lacks?
Save graphs like above for your marketing material. It is not how we communicate speaker performance here. And certainly don't brag about how good they are when they are wrong at very basic level.
OP
- Thread Starter
- #206
Of course they are and I have explained in detail. No measurement I have ever post looks like this:
This is what they look like from a very good monitor: Neumann KH310:
See the difference in clarity? How everything can be easily read. And how the on-axis graph has many ups and downs that yours above completely lacks?
Save graphs like above for your marketing material. It is not how we communicate speaker performance here. And certainly don't brag about how good they are when they are wrong at very basic level.
As indeed I explained in detail why you are wrong in your assertions.
As pointed out Amir, the on screen vertical axis is almost identical to yours so there is no appreciable compression of the Y scale. Please just look at the below pictures taken straight from the screen, left is your plot, right is mine. Note where the dB graduations lie with respect to each other. Almost identical.
Equally the X axis span is very similar.
If you are worried about clarity then, as you well know (and a tip for any other readers), if you click on the picture a higher resolution version pops up which is crystal clear.
The only issue here is the use of different smoothing, which as I pointed out, you use different measurements/settings for different purposes. Psychoacoustic smoothing will more accurately represent what you actually hear. However if you were looking for resonances, as an example, you would use a different setting.
Also I have posted higher resolution plots than yours as an addition (1/24th v 1/20th smoothing). So I am clearly not trying to hide anything here and I do take exception to you erroneously asserting I am misleading people.
So can we move on?
Last edited:
Isn’t this a typo, as shouldn’t it be 100:1 (20Hz-2kHz forming a square aspect ratio with the 50dB scale)?From CEA-2034 specifications:
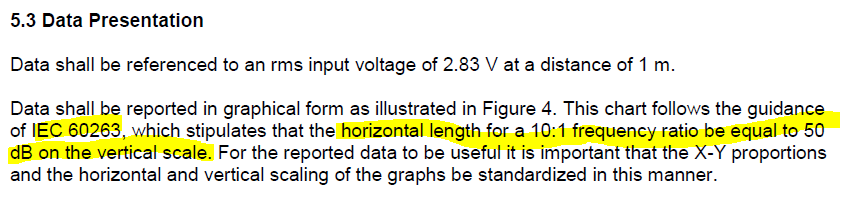
Also, as he pointed out, his scale is large, but the graph is tall so the y-axis isn’t really compressed. By my eye though, the aspect ratio is a little wider than the IEC standard (no where near as wide as the graphs I used to post though).
_____
Back to the speaker; without making a huge crossover change, can something be done with the 3kHz dip? I see from the PIR curve that it mostly goes away, but it still slightly there, and will be more present to those looking to use these in the near-field (though near-field likely means computer, in which an EQ program can be easily used; at least for Windows).
Last edited:
OP
- Thread Starter
- #209
Indeed, I am already looking at it.Amirs graph is indeed readable even on mobile without zooming. It wouldn't hurt tweaking the REW fonts and stuff.
OP
- Thread Starter
- #210
I
Back to the speaker; without making a huge crossover change, can something be done with the 3kHz dip? I see from the PIR curve that it mostly goes away, but it still slightly there, and will be more present to though looking to use these in the near-field (though near-field likely means computer, in which an EQ program can be easily used; at least for Windows).
Yes, one of the objectives of these "final" measurements made under more controlled conditions is to understand and minimise that anomaly.
One of the biggest problems with speaker design is that unless your measurements are as accurate as possible you can end up chasing your tail correcting things that dont need it and missing things that do.
@amirm and @March Audio in this case you both were right somehow.
The chosen scaling and smoothing does not correspond to the common representation here. But the display chosen by March Audio is not misleading (visually maybe a little bit).
The diagram below shows the frequency response of KH310 (1/20 oct smoothing), Sointuva 1/24 oct smoothing and Sointuva 1/3 smoothing (the smoothing called "Psychoacoustic smoothing" by @March Audio)
If you look at the "ripple" of the speaker in the range 0.1-10kHz, it is 5.6dB with 1/24 oct smoothing and 4.9dB with 1/3 oct smoothing - this is not dramatically different.
But what should be checked is the measurement of the low frequency range.
As a purple curve I added a second order high pass @40Hz. This is how a ideal closed box loudspeaker would behave.
When using BR or PR the curve should (at the latest) slope with higher order in the frequency range below the tuning frequency - you would expect 3rd to 5th order, depending on the tuning.
In the 40-20Hz range, the 2nd order filter (@40Hz, purple curve) drops by about 9dB. But the Sointuva measurement shows a sound pressure drop of just 5dB in this range, so it behaves almost like a 1st order filter - physically this would be very unusual for a BR and especially for PR loudspeaker type.
The Purifi passive radiator has a resonance frequency of 17Hz, at this point the frequency response should actually show a clear dip, which causes the frequency response around this area to drop much steeper than with a BR tuning - nothing of this can be seen on the measurement.
In comparison, the frequency response of the KH310 in @amirm's measurement falls almost like an ideal 5th order high pass @33Hz - which you would expect from a loudspeaker with BR plus HP, as protection against excessive membrane excursion below the tuning frequency.
OP
- Thread Starter
- #212
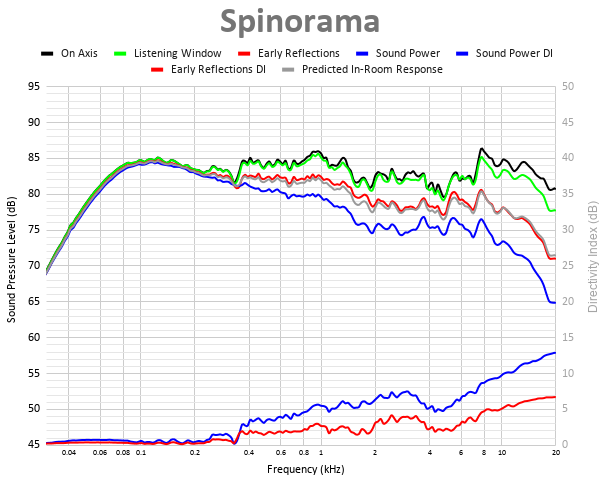
Graph test using REW 50dB/decade aspect ratio
How is this looking?


How is this looking?
OP
- Thread Starter
- #213
Please bear in mind my above comments about the wind and very low frequency accuracy. Its why we aborted the session.@amirm and @March Audio in this case you both were right somehow.
The chosen scaling and smoothing does not correspond to the common representation here. But the display chosen by March Audio is not misleading (visually maybe a little bit).
The diagram below shows the frequency response of KH310 (1/20 oct smoothing), Sointuva 1/24 oct smoothing and Sointuva 1/3 smoothing (the smoothing called "Psychoacoustic smoothing" by @March Audio)
If you look at the "ripple" of the speaker in the range 0.1-10kHz, it is 5.6dB with 1/24 oct smoothing and 4.9dB with 1/3 oct smoothing - this is not dramatically different.
But what should be checked is the measurement of the low frequency range.
As a purple curve I added a second order high pass @40Hz. This is how a ideal closed box loudspeaker would behave.
When using BR or PR the curve should (at the latest) slope with higher order in the frequency range below the tuning frequency - you would expect 3rd to 5th order, depending on the tuning.
In the 40-20Hz range, the 2nd order filter (@40Hz, purple curve) drops by about 9dB. But the Sointuva measurement shows a sound pressure drop of just 5dB in this range, so it behaves almost like a 1st order filter - physically this would be very unusual for a BR and especially for PR loudspeaker type.
The Purifi passive radiator has a resonance frequency of 17Hz, at this point the frequency response should actually show a clear dip, which causes the frequency response around this area to drop much steeper than with a BR tuning - nothing of this can be seen on the measurement.
In comparison, the frequency response of the KH310 in @amirm's measurement falls almost like an ideal 5th order high pass @33Hz - which you would expect from a loudspeaker with BR plus HP, as protection against excessive membrane excursion below the tuning frequency.
View attachment 95509
If you are just going by simulation/modelling then my chosen alignment is below.
Which I think is what I have quoted elsewhere.
Definitely easier to read and judge those values with psychoacoustic smoothing than 1/24th
Last edited:
Back to the speaker; without making a huge crossover change, can something be done with the 3kHz dip?
The dip in the axis frequency response should not be linearized under any circumstances - rather, depending on listening taste, it may be spread a bit more.
Otherwise you will end up with a totally messed up sound radiation, which should look something like this horizontally:
As @March Audio said, just ignore it.
As stated, it’s not actually 50dB/decade; it’s supposed to be a 100:1 ratio on the x-axis, not 10:1Graph test using REW 50dB/decade aspect ratio
How is this looking?
View attachment 95529
View attachment 95531
See my Spin for the SPK5:
I had to take a ruler to my screen make sure it was correct, as Sheets is a pain in this regard.
Again though, I thought your original large graph was fine.
______
I didn’t say get rid of it, as I noted it’s less severe in the PIR; just to tame it.The dip in the axis frequency response should not be linearized under any circumstances
OP
- Thread Starter
- #216
Im not sure about this. My reading is that with a 10:1 the x axis would be twice as wide as the Y axis assuming a 20kHz span. Amirs plots conform to this.As stated, it’s not actually 50dB/decade; it’s supposed to be a 100:1 ratio on the x-axis, not 10:1
See my Spin for the SPK5:
I had to take a ruler to my screen make sure it was correct, as Sheets is a pain in this regard.
Again though, I thought your original large graph was fine.
______
I didn’t say get rid of it, as I noted it’s less severe in the PIR; just to tame it.
Last edited:
OP
Yep, that's what I thought.Reading the F3 from the earlier measurement ties up surprisingly well with the model. (wind noise not withstanding)
F6 was not accurate due to wind noise
A -6dB point of about 26Hz (at an efficiency of 85.5dB), would also be quite unusual for a 6.5'' chassis and would considerably limit the SPL of the loudspeaker (even with +-10mm linear excursion)
OP
- Thread Starter
- #219
To gain more accuracy tomorrow (supposed to be very little wind) I will also use a dead cat wind shield instead of the normal foam one and higher SPL specifically to look at the low frequencies. Cant use this for full range as it will attenuate high frequencies
Last edited:
OP
- Thread Starter
- #220
What music has much content at 26Hz?Yep, that's what I thought.
A -6dB point of about 26Hz (at an efficiency of 85.5dB), would also be quite unusual for a 6.5'' chassis and would considerably limit the SPL of the loudspeaker (even with +-10mm linear excursion)
Aaah sorry might be talking at cross purposes
F3 should be about 39 Hz.- Status
- Not open for further replies.
Similar threads
- Replies
- 117
- Views
- 24K