• WANTED: Happy members who like to discuss audio and other topics related to our interest. Desire to learn and share knowledge of science required. There are many reviews of audio hardware and expert members to help answer your questions. Click here to have your audio equipment measured for free!

JBL 4309 Review (Speaker)

ezra_s

Active Member
Forum Donor
Joined
Mar 23, 2020
Messages
293
Likes
327
Location
Spain
I see what some people say here. From my ignorant point of view I see wiggly lines in the in-room response much more than other speakers teared to shreds in the forums, like the Buchardt S400 which brought streams of blood in the streets of ASR and then I wonder, and my first thought was Whaaat?

But then I remind @amirm background, his criteria and so much he has done until now and compare it to mine, and I can't help but trust his judgement more than any imaginative thought I could have, and instead of thinking WTF is this I think.. mmm.. It would be pretty interesting if he could compare this to some other similar sized speaker with a more flat in-room response and see the conclusions... o_O;)
 

xaviescacs

Major Contributor
Forum Donor
Joined
Mar 23, 2021
Messages
1,501
Likes
1,980
Location
La Garriga, Barcelona
Absolutely. I'd be very easy pop that in Excel and do a linear fit and extract the slope of that line. Then the "tilt", quite important in describing the general tone of the speaker, will be objective and accurate.
I haven't looked how the Olive score is calculated, and I should if I want to talk about this, but I imagine it's a bit more sophisticated than a simple least squares regression. However, as a starting point it would be something, and I strongly believe that is better to discuss about an imperfect model than about an imperfect adjective. It's not the end of the world of course, as there measurements and the data is there. I'm an ignorant of this audio matters, and quite possibly all I'm saying is written in some paper, just pouring some thoughts.
 
OP
amirm

amirm

Founder/Admin
Staff Member
CFO (Chief Fun Officer)
Joined
Feb 13, 2016
Messages
44,679
Likes
241,117
Location
Seattle Area
The only other thing I'd caution is that I'm not sure much of the things people are calling resonances are actually resonances, as in with audible ringing in the time domain.
Just adding to this, it is possible that some of these jaggies are caused by NFS. Reflections occur from the chassis of the system. And some may be due to computational errors. As such, one needs to let the eye smooth some of the over.
 
OP
amirm

amirm

Founder/Admin
Staff Member
CFO (Chief Fun Officer)
Joined
Feb 13, 2016
Messages
44,679
Likes
241,117
Location
Seattle Area
@amirm Would it be an idea to listen to this speaker back to back with a Revel M106 (which I believe you own) and give us your impressions? Since they're both $2k a pair it would make for an interesting comparison.
Not anymore as I shipped the unit back to its owner yesterday so we get his feedback.
 

Rottmannash

Major Contributor
Forum Donor
Joined
Nov 11, 2020
Messages
2,986
Likes
2,633
Location
Nashville
I've been quiet lately, but I must comment this thread, because this is in the heart of my criticism against loudspeaker reviews at ASR.

index.php

"Science" in audio evaluations is a sword with two blades. Klippel NFS gives HQ measurement data which can be presented in many ways and even scored to give preference. Distortion behaviour with high spl is as well very important basic info.

The problems come when data gets analyzed and compared to listening impression - human perception and individual preferences can overrule some measured imperfections and reveal some features measurements cannot. One basic thing is to realize the size and type of the loudspeaker in question - is it a desktop monitor, sound bar, stand-mount hifi, PA, a full-range ultimate hifi or what. We must correlate the expectations of eg. bass reach and spl capacity to "type", we can't use same scale for all speakers. As well the Olive/Harman score misses bass reach and spl capacity.

What I'd want to see in tests, is more thorough investigation of obvious problems in measurements or listening test. Eg. in this case, what is the cause of zero directivity at 1.1kHz? Fronside ports resonance at 800Hz is another obvious problem, but not audible.

I have learned to understand Amir's personal assessment priorities, and sort of read through it. He listens to a single speaker in his garage and makes it play very loud. When a small speaker sounds thin or distorts, the panther's head drops off, no matter how good Klippel measurements are. For stereo hifi listening in domestic rooms, different types of speaker interact with the room differently which highly affect bass quality and imaging, and we can't directly see this from measurements and Amir's review.

Anyway thank you very much Amir for providing these tests and reports!
I believe he listens in his upstairs listening room w/ the big-boy ML amps. Gotta have those kW amps in play.
 
OP
amirm

amirm

Founder/Admin
Staff Member
CFO (Chief Fun Officer)
Joined
Feb 13, 2016
Messages
44,679
Likes
241,117
Location
Seattle Area
What I do miss in these reviews are a bit more numbers. For instance, the analytical form of the drawn straight lines in the spinorama plots. And if the lines are found by some kind of regression, the usual output statistics of the model, e.g. R².
To be clear, for spin graph, I am not plotting any kind of regression but just a flat line which is our target for on-axis response. I do try to match the start of it at 200 Hz but otherwise it is always a horizontal line as a visual aid.

On the other graphs, I do make up the slope by eye. :) I don't know that any kind of regression analysis produces the perceptual tonality of the speaker better. I know the Olive score uses such but I don't know of any independent analysis of its relevance. And at any rate, we have had discussions about the score punishing speakers that have more flat response.
 
OP
amirm

amirm

Founder/Admin
Staff Member
CFO (Chief Fun Officer)
Joined
Feb 13, 2016
Messages
44,679
Likes
241,117
Location
Seattle Area
For the end user, the information about "audible distortion" is certainly useful. But it is also very vague, since you do not mention the corresponding amplifier voltage or the corresponding sound pressure level, and the perception of how "loud" a loudspeaker is playing depends very much on its tuning.
True that. But, since music spectrum varies so much, a hard number is not likely to be useful either.
How exactly to define a measure of dynamic compression certainly requires discussion. In purely formal terms, any deviation in frequency response at different sound pressure levels means the presence of dynamic compression (or limiter or resonances).
Why wouldn't it be harmonic distortion causing these slight variations for example? Or resonances through the chassis of Klippel NFS?

I think the only way to understand these things are useful is to have instrumentation of the driver at the same time to compare and confirm. Otherwise we are generating a bunch of graphs which only serve to make these measurements more convoluted and for fewer people to understand.

My goal with all of my measurements is to have just enough and no more. "Would be nice" does not qualify in my book. Every measurement needs to be highly defensible when challenged. And value shown in some regard.
 

Newman

Major Contributor
Joined
Jan 6, 2017
Messages
3,530
Likes
4,370
Just adding to this, it is possible that some of these jaggies are caused by NFS. Reflections occur from the chassis of the system. And some may be due to computational errors. As such, one needs to let the eye smooth some of the over.
Can’t remember which recent speaker review it was, where variations from Harman’s own FR outside of the bass were firmly explained by other members as “NFS has higher resolution than Harman’s measurement method”.

Good to see that it’s not that simple.
 

xaviescacs

Major Contributor
Forum Donor
Joined
Mar 23, 2021
Messages
1,501
Likes
1,980
Location
La Garriga, Barcelona
To be clear, for spin graph, I am not plotting any kind of regression but just a flat line which is our target for on-axis response. I do try to match the start of it at 200 Hz but otherwise it is always a horizontal line as a visual aid.

On the other graphs, I do make up the slope by eye. :) I don't know that any kind of regression analysis produces the perceptual tonality of the speaker better. I know the Olive score uses such but I don't know of any independent analysis of its relevance. And at any rate, we have had discussions about the score punishing speakers that have more flat response.
Thanks. I'm reading Olive's paper :)
 

Robbo99999

Master Contributor
Forum Donor
Joined
Jan 23, 2020
Messages
6,996
Likes
6,866
Location
UK
True that. But, since music spectrum varies so much, a hard number is not likely to be useful either.
But it would still provide an upper limit of roughly safe peak RMS input voltage, and you could always test with a few tracks that are recorded loud close to 0dFS. That information would have been useful in the 308p review for instance when you noted that the amplifier clipped when you put too much input voltage into it - would have been useful to know if that occurred above the manufacturer stated 2V in specs or if it was below & if so how much.
 

pierre

Addicted to Fun and Learning
Forum Donor
Joined
Jul 1, 2017
Messages
964
Likes
3,058
Location
Switzerland
What I do miss in these reviews are a bit more numbers. For instance, the analytical form of the drawn straight lines in the spinorama plots. And if the lines are found by some kind of regression, the usual output statistics of the model, e.g. R².

I understand that using numbers is a serious commitment, but using words to evaluate the fit of a straight line though a set of points looks artificial and arbitrary. Well, it's just a personal thought without any base on the audio subject. I just see lines, which is nice, but I miss the parameters of those lines.
I do compute this numbers automatically. See my signature.
 

ctrl

Major Contributor
Forum Donor
Joined
Jan 24, 2020
Messages
1,633
Likes
6,241
Location
.de, DE, DEU
Why wouldn't it be harmonic distortion causing these slight variations for example? Or resonances through the chassis
It does not matter what causes the deviation in frequency response at different sound pressure levels.
It is all a limitation of the dynamic capabilities of the speaker.

My goal with all of my measurements is to have just enough and no more. "Would be nice" does not qualify in my book. Every measurement needs to be highly defensible when challenged. And value shown in some regard.
In my opinion, it's not about "nice to have" but about filling an information gap.

The CTA2034 and the single frequency response measurements give us information about the directivity, hor and ver radiation of the loudspeaker, allows predictions about direct sound and diffuse sound behavior.
Impedance measurement, CTA2034, CSD and near field measurements combined give us information about loudspeaker resonances.
Harmonic distortion measurements (generously interpreted ;)) allow some prediction on IMD, speaker power handling and possible negative aspects for long term use at certain sound pressure levels (hearing fatigue).

But we have almost no information about the "dynamic capabilities" of a loudspeaker - at most indirect clues via the measurement of harmonic distortion.
Does a loudspeaker reproduce sound pressure level peaks unchanged over the entire reproduction range? We cannot give this information. We lack an objective evaluation of the "dynamic capabilities" of a loudspeaker.

But we've had this discussion before, I've unfortunately been tempted to bring it up again (sorry for that) after the dynamic capabilities of the speaker were highlighted without any objective data to back it up.

Whether the method used by @hardisj is the solution for evaluating the dynamic capabilities of a loudspeaker can certainly be discussed (e.g. how "warm" should the loudspeaker mechanics be at the beginning of the test,...), but the results are sometimes astonishing.

A JBL M2 shows what you would expect, a KEF R2 center is better than expected and a speaker that is supposed to have extreme dynamic capabilities shows major weaknesses.
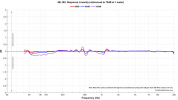
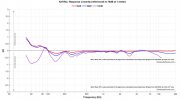
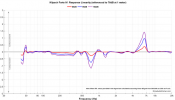
1634236150253.png 1634236172088.png 1634236188646.png
Source: erinsaudiocorner.com
 
OP
amirm

amirm

Founder/Admin
Staff Member
CFO (Chief Fun Officer)
Joined
Feb 13, 2016
Messages
44,679
Likes
241,117
Location
Seattle Area
A JBL M2 shows what you would expect, a KEF R2 center is better than expected and a speaker that is supposed to have extreme dynamic capabilities shows major weaknesses.
1634236150253.png 1634236172088.png 1634236188646.png
I don't see how you can rationalize anything in that Klipsch graph. It is showing increased output between 6 and 7 kHz. How did that reverse compression happen? It has a dip in that area by the way so if its amplitude is increasing, it is becoming flatter, not less flat!

That aside, there is no observation of level sensitive compression in his subjective notes. If this example of a "major weakness" did not cause any audible artifacts to be noted, what value is there when it is not showing such weakness?

Contrast that with my listening tests where I am able to easily assess limitations of speakers with proper content. The artifacts are all distortion related which anyone can hear and experience just as well.

If you want to read tea leaves for speaker running out of steam, then look at the distortion measurements. Not some differential frequency response measurements with no calibration of a known a sample to know if is even accurate.
 

ROOSKIE

Major Contributor
Joined
Feb 27, 2020
Messages
1,936
Likes
3,525
Location
Minneapolis
It does not matter what causes the deviation in frequency response at different sound pressure levels.
It is all a limitation of the dynamic capabilities of the speaker.
Howdy, I mentioned this earlier.
I don't think we can assume the speaker is dynamically limited based of a slight change in SPL in the low bass. You would want to see more examples at various SPL at the least and then still somewhat guessing.
My understanding (and I may be incorrect) is that the bass response of pretty much any speaker changes at high SPL vs low.
As I understand it the TS parameters change a bit(or even signifigantly) with temperature and the high internal SPL affects the box size the speaker "sees".
This means the tuning changes with a very high SPL, and higher temperatures vs a box with low internal SPL and driver with lower internal temps. Plus the inside of the box heats up.
0.5-1db maximum changes in the bass seem somewhat minor to me.
We should definitely see what is happening at even higher SPL before jumping to any conclusion.

Every time Voice coil magazine runs test box sims they show the prediction tuning at high and low SPL and they are always a bit different.

So if this is all true, then some changes in SPL at various volumes are simply due to changes in the effective tuning of the system and may not indicate a driver/speaker running out of gas.
 
OP
amirm

amirm

Founder/Admin
Staff Member
CFO (Chief Fun Officer)
Joined
Feb 13, 2016
Messages
44,679
Likes
241,117
Location
Seattle Area
It does not matter what causes the deviation in frequency response at different sound pressure levels.
It is all a limitation of the dynamic capabilities of the speaker.
No it isn't. A differential frequency response is just that: difference between two frequency responses. It does not automatically become a "compression" test. What if his amplifier ran out of power for example? How would that be speaker's problem?

The sweep is also full spectrum which is not what we have in music. In a low frequency bass note for example, the woofer moves creating circulation of air that cools the voice coil. With a sweep at higher frequencies doesn't happen so you will be putting the speaker in a different mode of operation.

In general, you have to be very, very careful in using differential measurements like this. It is very easy to boost tiny changes into large variations in graphs, creating concern for the eye when the underlying data doesn't support it. I can compare an MP3 output against a wave file using a null/differential test. Such a thing would show a lot of differences that would all of a sudden be obvious. But they are not in reality because of perceptual masking. Same here. Before you utilize these types of differential tests, you have to make sure there are no nuisance variables.

These are not electronic measurements. We have to allow some amount of roughness and inaccuracy in there. Until you quantify this, such graphs do not have value.

These graphs don't spit out any number as to audible compression levels anyway which was your criticism of my listening tests. You have difference between frequency responses, not anything that translates to audible artifacts.
 
OP
amirm

amirm

Founder/Admin
Staff Member
CFO (Chief Fun Officer)
Joined
Feb 13, 2016
Messages
44,679
Likes
241,117
Location
Seattle Area
0.5-1db maximum changes in the bass seem somewhat minor to me.
This is key. The main application for this type of tests is where the drop is large and hence, can be attributed to limitations in the speaker/amplifier. When it is tiny, who knows what it is.
 
OP
amirm

amirm

Founder/Admin
Staff Member
CFO (Chief Fun Officer)
Joined
Feb 13, 2016
Messages
44,679
Likes
241,117
Location
Seattle Area
No opinions? Anybody? Interesting...
No one can tell you if it is "$1,700" better. That is a baiting question. They are both similar in what they provide objectively and almost subjectively. I did not have both side by side but I tend to think the 4309 has better power capability.
 
Top Bottom