The FR script is insensitive to these types of anomalies as it time-slices the audio and grabs the largest bin in the given time slice. This means a resonance, etc. would need to have more energy than the fundamental within the time slice that the fundamental is being being measured. The most likely place to see this is at LF as the time slices are largest as are resonance due to arm/cart interaction.
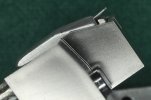
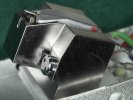
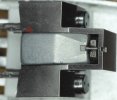
I've been thinking of a waterfall plot using FFT or maybe HT to provide a broader view, similar to the attached. It wouldn't replace the current FR functionality, but could be an interesting add-on to the test "suite".

I've been thinking of a waterfall plot using FFT or maybe HT to provide a broader view, similar to the attached. It wouldn't replace the current FR functionality, but could be an interesting add-on to the test "suite".


