Digital1955
Member
- Joined
- Feb 26, 2022
- Messages
- 61
- Likes
- 49
I have been inspired by @JP 's various scripts for measuring cartridge frequency response and plotting W&F. It gave me an idea of writing a similar script to calculate the RPM of a turntable platter with as much precision as possible. I settled on a method of using the 'click' that is produced as the stylus loops in a dead-end groove. The click is the result of the stylus passing by the entry groove into the dead-end groove each rotation. Because my main turntable (Sony PS-X50) auto-stops records, I ended up using a dead-end groove from the CBS STR-100 test LP (Issue 3). Band 3A has a low noise floor and produces a clean click waveform. I thought using this for testing was also helpful because I know a lot here have that particular LP. However, it isn't a requirement, any LP should work (they all have a dead-end groove, right?).
So I wrote the script in Python, to keep with what JP has done. You must make a WAV stereo recording of the stylus looping in the dead end groove. After that, using Audacity, I like to normalize it to 0 dB, so that I can easily visualize / count how many clicks I captured. You need to pass the number of clicks as an argument to the script, along with the minimum expected time (in ms) between clicks. This is so the script can easily identify the target clicks. The script then calculates the timing between click peaks with as much precision as available (according to the sample rate used). When it is completed, it then displays minimum, maximum, average, and standard deviation for both time intervals and RPM values.
I have decided to keep the script on github, for easier versioning and sharing. I have included a README with more information and instructions. That README links to this thread as the central place for discussion and results. However, I do have it in my mind that I would like to duplicate published user results in the github repo, similar to how AutoEq does.
Feel to review the technical accuracy of my statements and methods. You can give your comments here, or if you have a github id, you can also submit a pull request.
We can use this thread for discussion and results.
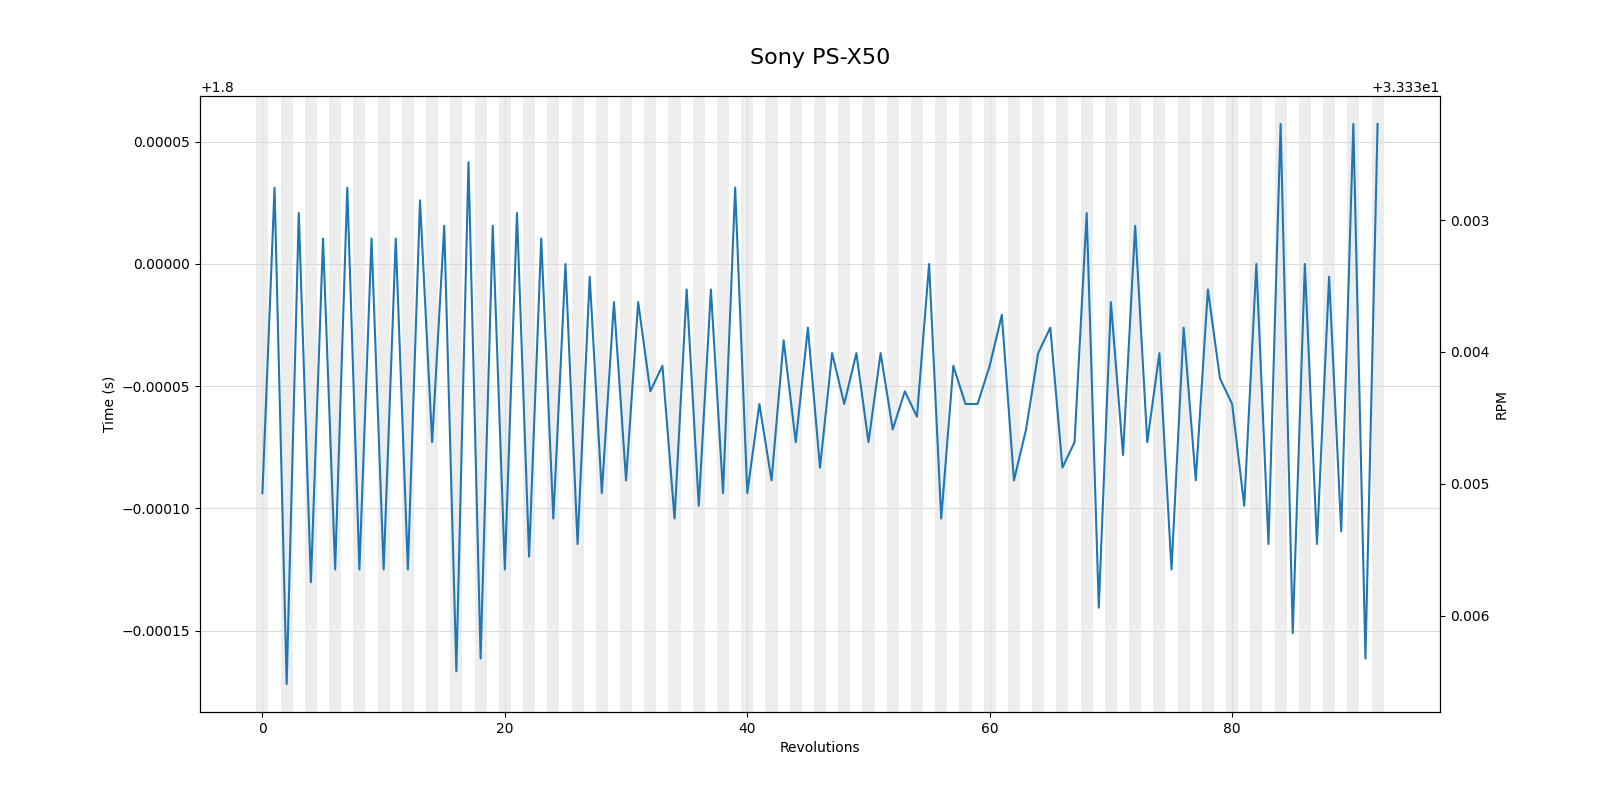
Below is an example of the output. It writes to standard out where the script is run (there aren't any chart, graph, or image generated). I tested running very long tests,
as well as back to back tests, 1 minute long each. The results are very consistent and stable regardless. This method is obviously only capturing the average RPM over
one revolution. I believe its uniqueness and usefulness is its accuracy. In addition, measuring the speed this way includes stylus friction.
Note that when reading the output, the minimal time interval produces the maximum RPM, the the maximum interval produces the minimal RPM.
LINK TO SCRIPT >>> Turntable RPM Analysis script on Github
So I wrote the script in Python, to keep with what JP has done. You must make a WAV stereo recording of the stylus looping in the dead end groove. After that, using Audacity, I like to normalize it to 0 dB, so that I can easily visualize / count how many clicks I captured. You need to pass the number of clicks as an argument to the script, along with the minimum expected time (in ms) between clicks. This is so the script can easily identify the target clicks. The script then calculates the timing between click peaks with as much precision as available (according to the sample rate used). When it is completed, it then displays minimum, maximum, average, and standard deviation for both time intervals and RPM values.
I have decided to keep the script on github, for easier versioning and sharing. I have included a README with more information and instructions. That README links to this thread as the central place for discussion and results. However, I do have it in my mind that I would like to duplicate published user results in the github repo, similar to how AutoEq does.
Feel to review the technical accuracy of my statements and methods. You can give your comments here, or if you have a github id, you can also submit a pull request.
We can use this thread for discussion and results.
Below is an example of the output. It writes to standard out where the script is run (there aren't any chart, graph, or image generated). I tested running very long tests,
as well as back to back tests, 1 minute long each. The results are very consistent and stable regardless. This method is obviously only capturing the average RPM over
one revolution. I believe its uniqueness and usefulness is its accuracy. In addition, measuring the speed this way includes stylus friction.
Note that when reading the output, the minimal time interval produces the maximum RPM, the the maximum interval produces the minimal RPM.
python3 rpm.py ~/test103c34.wav 34 1700 --channel_mode left

Channel mode: left
Revolutions: 33

Statistic            Time Intervals (s)                  RPM Values
------------------------------------------------------------------------------------------
Min                  1.7998958333333332504               33.3335262356842392251
Max                  1.7999895833333332540               33.3352624573181302026
Average              1.7999444444444443469               33.3343621830166867426
Std Dev              0.0000332055103909648               0.0006149542691192381
LINK TO SCRIPT >>> Turntable RPM Analysis script on Github
Last edited:
")