• WANTED: Happy members who like to discuss audio and other topics related to our interest. Desire to learn and share knowledge of science required. There are many reviews of audio hardware and expert members to help answer your questions. Click here to have your audio equipment measured for free!

Erin's Audio Corner gets a Klippel NFS!

richard12511

Major Contributor
Forum Donor
Joined
Jan 23, 2020
Messages
4,337
Likes
6,708
For me, the normalized plots are better for quickly assessing how consistent the directivity is. The non-normalized plots are more useful to me for quickly assessing how wide or narrow a speaker's dispersion is, though I personally find Erin's globe view even better for that. Tbh, you can kinda get all the information from all the graph styles if you study it close enough and consider other graphs. When I say one way is "better" for certain uses, I mainly just mean that my brain can get the information it's looking for faster. The "quickness" with which my brain can process it is important, since I really only use them for "quick" comparisons. As @napilopez said, for more exact comparisons (say looking for 1-2dB differences in particular ranges), the off axis SPL graphs are better.

I don't think there's a wrong/right answer here. I just think different people's brains work differently. The fact that we have people on both sides to me just says that both are useful to at least someone.
 

617

Major Contributor
Forum Donor
Joined
Mar 18, 2019
Messages
2,436
Likes
5,389
Location
Somerville, MA
I gotta be honest... this is kind of a hot mess. I do understand everyone's points. This just proves to us that we all have our own preference and sometimes just flat out think another's is dumb. :p

Though, to be honest, I most agree with @napilopez and feel that the heatmap graphics as typically presented are more just an "eyeball" chart to see how the directivity pattern trends. But, the DI data as well as the off-axis horizontal data also tell us that.

This is also why I came up with the globe polar; because it gives a much more intuitive feel for the radiation pattern of a speaker. You can more easily picture (in your mind) how the speaker's dispersion behaves all the way around and easily spot mismatches in directivity.

The globe polars are excellent and probably easier to explain to a layperson than a traditional sonogram. I'm completely confident you can explain the performance of these speakers.
 
OP
hardisj

hardisj

Major Contributor
Reviewer
Joined
Jul 18, 2019
Messages
2,907
Likes
13,916
Location
North Alabama
Today was an eventful day. The weather was finally nice enough for me to measure subwoofers outdoors so I measured both the SVS SB2000 Pro and the SVS SB3000 subwoofers. :)

3BDE8657-EDBA-4A51-A0C6-6981BDBA6E17.jpeg


I also finished testing of the Dutch & Dutch 8c. As some of you already know, the Dutch & Dutch 8c is a speaker that breaks the norm. It is designed to be placed near a back wall in order to provide boundary gain. In order to achieve boundary gain, however, a typical speaker also loses timbre due to the rear wall reflections. With a cardioid speaker (such as the D&D 8c), the rear wall reflections are effectively "muted" and you are left with a forward-firing only speaker above 100Hz (below which, the subs are omnidirectional but cut off sharply).

This presents a bit of a challenge when analyzing performance. Ideally you measure a speaker anechoically to see what happens when the room is not a factor in the performance. So, I did that using Klippel's NFS. This gives us all a baseline understanding of the speaker's performance. However, I also needed a way to characterize performance in the situation it is designed for: near a boundary for <100Hz reinforcement.

Therefore, I used high engineering (see: scrap wood) to build a platform for the speaker so the subwoofers could load off the ground - effectively becoming the "rear wall", if you will. And then I measured the performance in this manner.

Now I have a full SPIN set of data for anechoic measurements but we also have a quasi-anechoic measurement via the ground plane method to see how the boundary loading improves performance.

To be honest, there were a couple times today where I thought "I'm not getting paid enough to do this for free". :D


Anyway... stay tuned for results.
1f609.png
1f603.png


jhaider

Major Contributor
Forum Donor
Joined
Jun 5, 2016
Messages
2,874
Likes
4,677
I guess the way we look at polar plots is quite different. For me the only reason to even consider them is for a quick overview of directivity characteristics and nothing else-- SPL plots are just much clearer for precise information about what's happening at every angle.

Different strokes for different folks, I guess. I can't make heads or tails of out a line-salad graph. Soundstage's for instance just look archaic and unusable to me. However, a polar map just clicks. As for normalized vs. not, IMO, while both is ideal if only one is available give me not. However, Erin’s brilliant globe works just as well.

Also, I think it's easier to pick resonances out of a polar than a spin. Admittedly at that time VituixCAD didn't offer full spins, but I found it hard to visualize the main treble resonance in the Amphion Argon 3S from the power response and DI. Basically power was flat and DI dipped a bit. OTOH, the resonance is clear in both polar maps. Had the designers chose to design for flat on axis and smooth off axis instead of what appears to be a flattish power response target, the non-normalized polar would look cleaner. :)

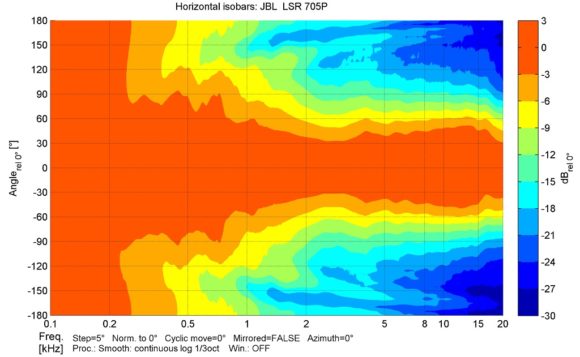
IMO the best-looking and most information-rich polar maps currently published are Sound und Recording's. Their steps do obscure some fine detail (1/3 octave smoothing, colorization more like a beamwidth graph than most polar maps) but they manage to convey both FR uniformity and directivity trends in a clean graph. For this speaker (JBL 705P) it doesn't especially matter, but their polar maps are not normalized.
JBL-705P-HOR-580x357.jpg

Source.

Unfortunately their software (Monkey Jungle or something like that) is very expensive.

My problem with non-normalized polar plots is that when evaluating speakers with notable peaks and dips in the frequency response, they make it look like there speaker has a directivity problem, when this is often not the case.

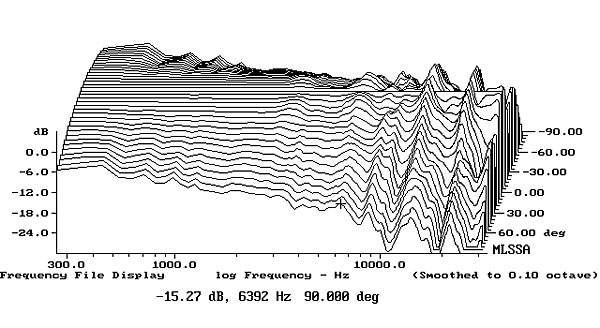
IMO the opposite is at least as often true. Here's Exhibit A, a graph that causes people with limited understanding of loudspeaker design to draw bizzarely false conclusions about the loudspeaker's treble directivity:


713TAD1fig5.jpg

Source.

The issue, of course, is narrow axial cancelation notches from a round waveguide, that (IMO) subjectively are of no consequence but make the treble performance look terrible on both an axial FR plot as well as any kind of normalized directivity spot. I have a soft spot for coaxes, which colors my view of normalized directivity plots. :)

As far as Erin's work, obviously he provides what he wants within his bandwidth limitations. I'm just happy to have another good source of reliable loudspeaker information. His globe presentation is innovative and useful, too. If I had my way it would be globes plus horizontal beamwidth (ideally colored between the lines so it looks like the S-und-R graphs more or less) but I'll take what I can get! :)
 
Last edited:

Kachda

Addicted to Fun and Learning
Forum Donor
Joined
May 31, 2020
Messages
909
Likes
1,616
Location
NY
Today was an eventful day. The weather was finally nice enough for me to measure subwoofers outdoors so I measured both the SVS SB2000 Pro and the SVS SB3000 subwoofers. :)

View attachment 114711


I also finished testing of the Dutch & Dutch 8c. As some of you already know, the Dutch & Dutch 8c is a speaker that breaks the norm. It is designed to be placed near a back wall in order to provide boundary gain. In order to achieve boundary gain, however, a typical speaker also loses timbre due to the rear wall reflections. With a cardioid speaker (such as the D&D 8c), the rear wall reflections are effectively "muted" and you are left with a forward-firing only speaker above 100Hz (below which, the subs are omnidirectional but cut off sharply).

This presents a bit of a challenge when analyzing performance. Ideally you measure a speaker anechoically to see what happens when the room is not a factor in the performance. So, I did that using Klippel's NFS. This gives us all a baseline understanding of the speaker's performance. However, I also needed a way to characterize performance in the situation it is designed for: near a boundary for <100Hz reinforcement.

Therefore, I used high engineering (see: scrap wood) to build a platform for the speaker so the subwoofers could load off the ground - effectively becoming the "rear wall", if you will. And then I measured the performance in this manner.

Now I have a full SPIN set of data for anechoic measurements but we also have a quasi-anechoic measurement via the ground plane method to see how the boundary loading improves performance.

To be honest, there were a couple times today where I thought "I'm not getting paid enough to do this for free". :D


Anyway... stay tuned for results.
1f609.png
1f603.png


Awesome. Looking forward to @sweetchaos adding the svs subs to his list
 

pierre

Addicted to Fun and Learning
Forum Donor
Joined
Jul 1, 2017
Messages
965
Likes
3,059
Location
Switzerland
If it Is a storage and or network issue, a better solution is to use JavaScript and render the graphs on the client side.
data are small: this will decrease storage cost and bandwidth.
JavaScript will let the end user tweaks the graphs how he wants.

@erins I can share some code if you want.
 

somebodyelse

Major Contributor
Joined
Dec 5, 2018
Messages
3,760
Likes
3,067
+1 for the client side rendering suggestion. Apart from the storage space advantage it means that any new display types that get added in future will become available for the speakers already tested.
 

pierre

Addicted to Fun and Learning
Forum Donor
Joined
Jul 1, 2017
Messages
965
Likes
3,059
Location
Switzerland
+1 for the client side rendering suggestion. Apart from the storage space advantage it means that any new display types that get added in future will become available for the speakers already tested.

I already have that, click in my signature. The website is automatically generated.
 
OP
hardisj

hardisj

Major Contributor
Reviewer
Joined
Jul 18, 2019
Messages
2,907
Likes
13,916
Location
North Alabama
I’m going to stick with the format I am using. I frankly don’t have time to learn a new coding language, nor do I want to depend on someone else to do things for me for a number of reasons. Between my full time job, testing, writing reviews and shooting videos, there just aren’t enough hours in the day. My main focus now is getting all the subs and speakers reviewed and published.
 

jtwrace

Major Contributor
Forum Donor
Joined
May 31, 2017
Messages
1,227
Likes
1,410
Location
Orlando, FL
Between my family, full time job, testing, writing reviews and shooting videos, there just aren’t enough hours in the day.
Corrected. ;-)
 

jtwrace

Major Contributor
Forum Donor
Joined
May 31, 2017
Messages
1,227
Likes
1,410
Location
Orlando, FL
What would be cool at this point to me, is if @amirm put a little Erin's Audio Corner; corner (sub forum) on this forum so all your stuff is in one place. I presume that you're going to post each and every review so it would be nice if each one had it's own thread. Just a thought.
 

jtwrace

Major Contributor
Forum Donor
Joined
May 31, 2017
Messages
1,227
Likes
1,410
Location
Orlando, FL
Indeed. I guess I meant all the stuff outside of that.
Yeah, I'm just reminding everyone else that you do have another big part of your life besides work and your hobby of testing speakers.
 

q3cpma

Major Contributor
Joined
May 22, 2019
Messages
3,060
Likes
4,419
Location
France
If it Is a storage and or network issue, a better solution is to use JavaScript and render the graphs on the client side.
data are small: this will decrease storage cost and bandwidth.
JavaScript will let the end user tweaks the graphs how he wants.

@erins I can share some code if you want.
I’m going to stick with the format I am using. I frankly don’t have time to learn a new coding language, nor do I want to depend on someone else to do things for me for a number of reasons. Between my full time job, testing, writing reviews and shooting videos, there just aren’t enough hours in the day. My main focus now is getting all the subs and speakers reviewed and published.
Or just use SVG, no need for another retarded "website that flat-out doesn't work without Jabbascript".
 
  • Like
Reactions: 617
Top Bottom