
-
WANTED: Happy members who like to discuss audio and other topics related to our interest. Desire to learn and share knowledge of science required. There are many reviews of audio hardware and expert members to help answer your questions. Click here to have your audio equipment measured for free!
You are using an out of date browser. It may not display this or other websites correctly.
You should upgrade or use an alternative browser.
You should upgrade or use an alternative browser.
New set of graphs for all speakers reviews
- Thread starter pierre
- Start date

OP
- Thread Starter
- #262
Hello,
you may have notice that I changed the URL for the site. It used to be on github, hosted for free but I hit the limit in terms of size, size of files, size of git pack etc too many times and it became really complicated to deal with the limits.
I chose the easy solution: self hosting.
I bought the spinorama.org domain that was not used for the next 10 years.
So now:
 www.spinorama.org
is the main site
www.spinorama.org
is the main site
https://dev.spinorama.org is the dev site (which may or may not work)
The site is hosted on 1 machine at the moment but soon 2 in 2 different places and I have a lot more bandwidth at the second one.
Load balancing will be done by the DNS so you may experience some outages when IPs change or when one server is rebooting.
Uptime will not be as good at github but should be good enough (99% is likely).
I was surprised to see that the audience is much higher that what I thought: 10k visitors per day from all over the world (after removing the bloody crawlers). So thank you all!
you may have notice that I changed the URL for the site. It used to be on github, hosted for free but I hit the limit in terms of size, size of files, size of git pack etc too many times and it became really complicated to deal with the limits.
I chose the easy solution: self hosting.
I bought the spinorama.org domain that was not used for the next 10 years.
So now:
A collection of loudspeakers measurements
www.spinorama.org
https://dev.spinorama.org is the dev site (which may or may not work)
The site is hosted on 1 machine at the moment but soon 2 in 2 different places and I have a lot more bandwidth at the second one.
Load balancing will be done by the DNS so you may experience some outages when IPs change or when one server is rebooting.
Uptime will not be as good at github but should be good enough (99% is likely).
I was surprised to see that the audience is much higher that what I thought: 10k visitors per day from all over the world (after removing the bloody crawlers). So thank you all!
Ah sorry, I'm not aware of an available data file. I wasn't sure if you were doing some chart digitizing from images to gather manufactacturer data sources.thanks that's nice. Do you see a file with data I could download? Or maybe you can ask them to share the data?
OP
- Thread Starter
- #264
i sometimes digitalized the spin (takes 10 minutes) but I am too lazy to do the 72 measurements when they are available.Ah sorry, I'm not aware of an available data file. I wasn't sure if you were doing some chart digitizing from images to gather manufactacturer data sources.
firestart3r
Member
- Joined
- Aug 17, 2021
- Messages
- 45
- Likes
- 13
Hello ! This tool is absolutly amazing, great work!
I have a UX suggestion:
- Could it be possible to select the line or lines we want to see in the graph ?
For example, when I compare two speakers, I would like to be able to see the "on axis of speaker A" and "on axis of speaker B".
Or "on axis speaker A" + "on axis speaker B" + "sound power di speaker A" + "sound power di speaker B"
Or "on axis speaker A" + "sound power di speaker B" (even if doesn't make sense).
The reason is that I have difficulty comprehending the big picture of the multiples lines displayed at the same time...
It could be a nice way to "unclutter" the graph for newbies like me. What do you think ?
Thank you")
I have a UX suggestion:
- Could it be possible to select the line or lines we want to see in the graph ?
For example, when I compare two speakers, I would like to be able to see the "on axis of speaker A" and "on axis of speaker B".
Or "on axis speaker A" + "on axis speaker B" + "sound power di speaker A" + "sound power di speaker B"
Or "on axis speaker A" + "sound power di speaker B" (even if doesn't make sense).
The reason is that I have difficulty comprehending the big picture of the multiples lines displayed at the same time...
It could be a nice way to "unclutter" the graph for newbies like me. What do you think ?
Thank you
AutomaticEQ (which are PEQs) are the most accurate.
But since not every hardware supports PEQs, you’ll likely use GEQs in those cases, which are less accurate but better than nothing.
For example:
-VLC media player doesn’t support PEQs, but it supports 31 band GEQs.
-Equalizer APO (for Windows) supports PEQs.
-MiniDSP hardware supports PEQs.
Most people should be using PEQs since most modern hardware supports it.
OP
- Thread Starter
- #271
Hello ! This tool is absolutly amazing, great work!
I have a UX suggestion:
- Could it be possible to select the line or lines we want to see in the graph ?
For example, when I compare two speakers, I would like to be able to see the "on axis of speaker A" and "on axis of speaker B".
Or "on axis speaker A" + "on axis speaker B" + "sound power di speaker A" + "sound power di speaker B"
Or "on axis speaker A" + "sound power di speaker B" (even if doesn't make sense).
The reason is that I have difficulty comprehending the big picture of the multiples lines displayed at the same time...
It could be a nice way to "unclutter" the graph for newbies like me. What do you think ?
Thank you
You can add/remove a graph by clicking in the legend. Each click toggle between visible/hidden states.
OP
- Thread Starter
- #272
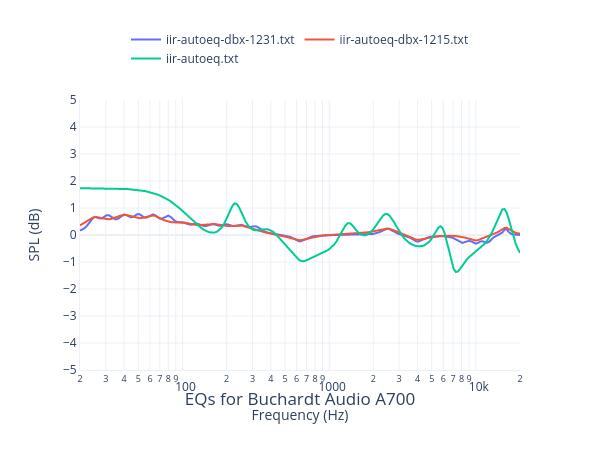
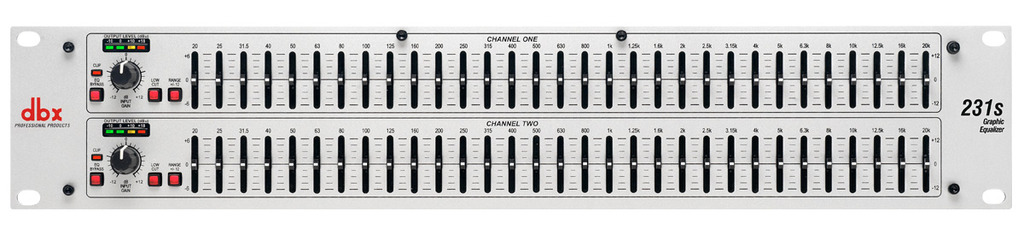
True. At the same time the differences are not so large. Here is an example with score being 7.23 with PEQ and 7.13 with GEQ, the difference 0.1 is not statistically significant. Honestly a basic GEQ like the DBX 231s for ~ 150$ does a good enough job.AutomaticEQ (which are PEQs) are the most accurate.
But since not every hardware supports PEQs, you’ll likely use GEQs in those cases, which are less accurate but better than nothing.
For example:
-VLC media player doesn’t support PEQs, but it supports 31 band GEQs.
-Equalizer APO (for Windows) supports PEQs.
-MiniDSP hardware supports PEQs.
Most people should be using PEQs since most modern hardware supports it.
firestart3r
Member
- Joined
- Aug 17, 2021
- Messages
- 45
- Likes
- 13
Amazing! Thank you PierreYou can add/remove a graph by clicking in the legend. Each click toggle between visible/hidden states.
tiago.trindade
Member
- Joined
- Jul 25, 2022
- Messages
- 32
- Likes
- 8
Hello,
Can we export the measurements data to use it as a “target/house curve” in REW?
Thanks
Can we export the measurements data to use it as a “target/house curve” in REW?
Thanks
@pierre heads up that your price ranges are not inclusive on either side, so anything right on the limits will get filtered out. Example: the Polk XT15 is filtered out if you select either "<100$" or "100$-200$".
The price ranges don't seem to consistently filter on price per speaker either. Example: the same 4 Polk models are displayed whether you choose "100$-200$" or "200$-300$"
Any chance of implementing a slider for price filtering?
The price ranges don't seem to consistently filter on price per speaker either. Example: the same 4 Polk models are displayed whether you choose "100$-200$" or "200$-300$"
Any chance of implementing a slider for price filtering?
kernelpanic
Member
- Joined
- Mar 19, 2019
- Messages
- 56
- Likes
- 34
I was just thinking about this the other day. A slider for pricing filtering would be amazing. The current dropdown selection has very limited filtering ranges. It would be nice to see all <$500 or <$1000, etc.@pierre heads up that your price ranges are not inclusive on either side, so anything right on the limits will get filtered out. Example: the Polk XT15 is filtered out if you select either "<100$" or "100$-200$".
The price ranges don't seem to consistently filter on price per speaker either. Example: the same 4 Polk models are displayed whether you choose "100$-200$" or "200$-300$"
Any chance of implementing a slider for price filtering?
OP
- Thread Starter
- #277
ok sliders it will be. I also have new parameters (size, weigth, …, sensitivity, max spl etc) most would be better with a slider.I was just thinking about this the other day. A slider for pricing filtering would be amazing. The current dropdown selection has very limited filtering ranges. It would be nice to see all <$500 or <$1000, etc.
bennybbbx
Addicted to Fun and Learning
I had some time to kill in a plane and I played with all the data’s that Amir gives us.
you can see them on www.spinorama.org The code to generate them is On github Too.
your display site is great, only small change, can you please change the low freq limit (currently it is 100 hz )in the SPL contour graph from 100 to maybe 50 or at last 80 hz ?. the directivity of subwoofer dipol or not is report here. https://www.linkwitzlab.com/AES'98/aes-98.htm
there are diffrences . also a rear bass port can act as a little dipol at some frequencies. so it is usefull to see below 100 hz because below 100 hz also the bass port do putput more
OP
- Thread Starter
- #279
your display site is great, only small change, can you please change the low freq limit (currently it is 100 hz )in the SPL contour graph from 100 to maybe 50 or at last 80 hz ?. the directivity of subwoofer dipol or not is report here. https://www.linkwitzlab.com/AES'98/aes-98.htm
there are diffrences . also a rear bass port can act as a little dipol at some frequencies. so it is usefull to see below 100 hz because below 100 hz also the bass port do putput more
yes, that’s easy to do.
Similar threads
- Replies
- 11
- Views
- 1K
- Poll
- Replies
- 333
- Views
- 54K
- Replies
- 106
- Views
- 29K
- Replies
- 92
- Views
- 12K
- Replies
- 313
- Views
- 61K