I have only recently used:
Tbh, idk if it makes much sense to attempt this. I mentioned the idea only to illustrate that frequency analysis can be a tricky business and finding a good position among the inherent trade-offs of the various choices involves subjectivity.
- Reaper which comes with a spectrum analyzer as I demonstrated in the video, but this doesn't seem suitable to producing a single hi-res characteristic spectrum for long segment (e.g. 10 seconds of music)
- Visual Analyser https://www.sillanumsoft.org/ idk if it can do it. it is certainly very flexible
- REW has a decent analyzer but again idk what options it has for combining a sequence of hi-res FFTs
Many options to analyze tracks, here is some. They will show exactly what is there.
Audacity:
Plot Spectrum - Audacity Manual
manual.audacityteam.org
Spectrogram using SOX:

BASS!
Post some nice examples of tracks that can challenge your system/headphones with lower spectrum notes. Try to include not only tracks from a "reference test suite" category but also those that are fun to listen (or you like personally). Although it's natural to expect some electronic music...audiosciencereview.com

BASS!
Spectrum from Falcon Heavy recording, above: About -20dB/decade from 10 to 1000Hz, then -30dB from 1k to 10kHz. I'd wager it doesn't really roll off below 10Hz as shown. --- Acoustic/infrasonic rocket engine signatures https://ui.adsabs.harvard.edu/abs/2003SPIE.5090...30T/abstract...audiosciencereview.com
Good realtime analyzer for foobar2000 users:
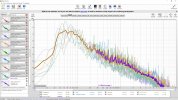
Earlier in the thread some of us were talking about how these PA speakers lack subbass and whether or not a subwoofer would be needed for various applications with these PA speakers. I think they certainly would for a proper bass response. We then got on to talking about how to actually analyse bass content accurately in tracks as some real time spectrum analysers seem to sometimes give a false impression that a lot of subbass is being used when it might not be there. One of the solutions that seemed to be arrived at was to run your music tracks through an analyser to get a characteristic frequency response curve that characterises the whole track. I decided to therefore run what I consider some of my most bass heavy music through this analyser (lots of Massive Attack tracks) - I used Audacity and exported the results to REW, following is a plot of all those tracks together:Well, I suppose there are different ways to collect and look at data.
For me, the point was to see how playback through speakers related to the source.
I figured if the peaks match up, then what goes on at lower levels likely matches too.
I came close enough for my purposes, I think.
Below, Left and Right of the CD source (no EQ), and the combined result coming from the speakers measured at the listening position, at 10 feet (with EQ)...
Top trace is the "in-room", with considerable DSP to make the in-room frequency response follow the source. The "room curve" applied via DSP is flat - no curve or slope.
The speakers are playing the stereo source, so what is picked up by the microphone is the sum of the two channels.
The most inaccurate area is the bass, below maybe 80Hz, background noise intrudes on the silence of the source below 25Hz, and the rest of the bass response is a bit ragged.
Such is life.

To me from that graph, I think you'd want your speaker to be able to reproduce down to 30Hz properly for most of those tracks, and there's two tracks that to me look like they have significant content down to 20Hz. I don't know what you guys would interpret from that graph, maybe the same? I'd say that for certain for those traces you'd be wanting to have a sub paired with these PA speakers for example, what do you reckon?
EDIT: these are based on FFT 8192 and Hann Window in Audacity.
EDIT #2: also did a version of the graph above but with an average line that represents all tracks, which is the highlighted purple line in the following graph - to get a handle on some more general trends (curiosity), see following thumbnail:

Last edited:


