• WANTED: Happy members who like to discuss audio and other topics related to our interest. Desire to learn and share knowledge of science required. There are many reviews of audio hardware and expert members to help answer your questions. Click here to have your audio equipment measured for free!

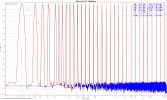
RME ADI-2/4 Pro SE - Auto-measured with Multitone

andy3d

Member
Joined
Dec 23, 2023
Messages
14
Likes
8
@weme
yes, that's recent MBBM (acousticians Michael Pruefer and Eckard Mommertz) and Kahle Acoustics as Acoustical Client Advisor (Eckhard Kahle) concert hall project in Warsaw. Not build yet. As the interior is rather atypical as for a concert hall, model was helpfull to investigate the uniformity of reflections. But as You can see from the video, such large models (1:10 scale) are mostly marketing tools :) From purely acoustical point of view, it does not make sense to play music in it :)))

Impulse responses measured in such models can be used to make auralizations of music recorded in anechoic chambers. That's why for auralizations we need such a high sampling frequency of sound cards. With a typical 192kHz, and 1:20 scale, one can only reach max 4,8kHz in real audiable range (192kHz/2 = 92kHz / 20 = 4,8kHz). That's almost sufficient for all acoustical measurements (we measure up to 5000Hz typically), but not sufficient for auralizations. A music auralized based on an impulse response restricted in frequency to 4,8kHz does not sound nice :) A card with 768kHz sampling rate in 1:20 scale model can (in theory) reach 19,2kHz ((768kHz/2)/20=19.2kHz) so almost full audiable range. In 1:10 scale model it's even simpler, and a card with 384kHz is sufficient ((384kHz/2)/10=19,2kHz).

Ultrasonic microphones we use (GRAS or B&K) are limited typically to 100~140kHz (or a bit higher if You allow for few -dB more from linearity), wich will again restrict your audiable range to approx 14kHz in 1:10 and 7kHz in 1:20. Building scale models in larger scales (1:10 and not 1:20) allows to make better auralizations, but 1:10 scale model is about 20x more expensive than 1:20 one (cost of some 1:10 recent scale models for European concert halls was in the range of 250k~800k Euro). And auralizations are really not the main aspect of why we build those models, however from marketing point of view a 1:10 scale model is much, much more nicer :cool:
 

Ratterbass

Member
Joined
Jan 14, 2024
Messages
6
Likes
4
@pkane thank you for all the work! great tool, I have been missing the options for sequenced measurements at home. I use it in parallels VM on a M1pro Macbook with audio feedthrough from mac to windows. Works well so far.

I tried to run your ADI 2/4 test file with my adi 2/4 (although just with XLR out to XLR in, no M/S processing) and I'm getting warnings after each pass with the linearity test. "Not enough data" I first thought this might be related to the very low signals the test starts with, but the warning occurs right to the end, even at 0dbFS. The resulting graph looks fine as well. This also happens with other interfaces I've tested. Otherwise no issues.

Is this a bug? Might this be related to the program running in a VM? I have yet to test it on a hardware PC.

Side note: would it be possible to inlcude a dark mode for the night dwellers? ;)
 
OP
pkane

pkane

Master Contributor
Forum Donor
Joined
Aug 18, 2017
Messages
5,712
Likes
10,406
Location
North-East
@pkane thank you for all the work! great tool, I have been missing the options for sequenced measurements at home. I use it in parallels VM on a M1pro Macbook with audio feedthrough from mac to windows. Works well so far.

I tried to run your ADI 2/4 test file with my adi 2/4 (although just with XLR out to XLR in, no M/S processing) and I'm getting warnings after each pass with the linearity test. "Not enough data" I first thought this might be related to the very low signals the test starts with, but the warning occurs right to the end, even at 0dbFS. The resulting graph looks fine as well. This also happens with other interfaces I've tested. Otherwise no issues.

Is this a bug? Might this be related to the program running in a VM? I have yet to test it on a hardware PC.

Side note: would it be possible to inlcude a dark mode for the night dwellers? ;)
Hard to tell why it's not capturing enough data. A few things that might help: try increasing warm-up time. You can set it to 0.5 second or even 1 second. Try increasing FFT size and/or average size. If you're using a large FFT size, try lowering it. You can stop the sweep right after the error and switch to Spectrum view or Waveform view to see what was captured. With VMs, I've seen occasional delays during capture that can result in missing data. Giving the VM more CPUs, more memory, and setting higher CPU priority in MTA might help:

1706271449865.png


For a dark(er) mode, set the plot to high-contrast and re-run a measurement. This changes plot colors to dark background:

1706271560118.png
 

Ratterbass

Member
Joined
Jan 14, 2024
Messages
6
Likes
4
Ok I got going (kind of) on a windows 11 machine (not VM). There are still some issues with the THD+N measurement as the program always gets stuck at some point when doing the measurement. Mostly it's on the "waiting" part. Other measurements run fine.

Only works with WASAPI, with ASIO drivers the test plan doesn't run at all. Only executes the first measurement and then stops.

Anyways, here are the results with single channel measurement with a single XLR cable on +24dBu on both in and output with -0.5dB on the output as to not clip.


1k Distortion Panel - Spectrum.png


Noise Floor - Spectrum.png


TD+N vs Frequency - Freq Sweep.png
Linearity - Lvl Sweep.png

32 Multitone - Spectrum.png
Crosstalk - Freq Sweep.png
DIM 30 - Spectrum.png
IMD DIN Sweep - Lvl Sweep.png
IMD SMPTE vs Level - Lvl Sweep.png
Intersample Overs 7.35kHz - Spectrum.png
Intersample Overs 7.35kHz - Waveform.png
J-Test 24 @44.1k - Spectrum.png
Log Sweep FR (4M) - Freq Response.png
Log Sweep FR (4M) - Phase.png
Log Sweep FR (4M) - Impulse.png


I think these numbers look OK, but there are twothings standing out to me:

1) Crosstalk seems a bit high?
2) IMD has a pretty high hump, even exceeding THD+N at one point. I don't see this in other measurements?
 

Sokel

Master Contributor
Joined
Sep 8, 2021
Messages
6,133
Likes
6,219
Ok I got going (kind of) on a windows 11 machine (not VM). There are still some issues with the THD+N measurement as the program always gets stuck at some point when doing the measurement. Mostly it's on the "waiting" part. Other measurements run fine.

Only works with WASAPI, with ASIO drivers the test plan doesn't run at all. Only executes the first measurement and then stops.

Anyways, here are the results with single channel measurement with a single XLR cable on +24dBu on both in and output with -0.5dB on the output as to not clip.


View attachment 348198


View attachment 348199


View attachment 348200View attachment 348201
View attachment 348202View attachment 348203View attachment 348204View attachment 348205View attachment 348206View attachment 348207View attachment 348208View attachment 348209View attachment 348210View attachment 348212View attachment 348211


I think these numbers look OK, but there are twothings standing out to me:

1) Crosstalk seems a bit high?
2) IMD has a pretty high hump, even exceeding THD+N at one point. I don't see this in other measurements?
ESS hump right at the 30's point,typical but really minor here.
 

Ratterbass

Member
Joined
Jan 14, 2024
Messages
6
Likes
4
And here are the results with using the 3/4 headphone output and a split cable to both inputs in M/S mode.

1k Distortion Panel - Spectrum.png

TD+N vs Frequency - Freq Sweep.png
Noise Floor - Spectrum.png
32 Multitone - Spectrum.png
Crosstalk - Freq Sweep.png
DIM 30 - Spectrum.png
IMD DIN Sweep - Lvl Sweep.png
IMD SMPTE vs Level - Lvl Sweep.png
Intersample Overs 7.35kHz - Spectrum.png
Intersample Overs 7.35kHz - Waveform.png
J-Test 24 @44.1k - Spectrum.png
Linearity - Lvl Sweep.png
Log Sweep FR (4M) - Freq Response.png
Log Sweep FR (4M) - Impulse.png
Log Sweep FR (4M) - Phase.png


Crosstalk is worse then with XLR, which is expected but at least it's pretty constant.

I will have to throw together an adapter for XLR to properly test the full range. But I don't think I will be seing numbers below the 120s with this unit like I have seen with some others.
 

Attachments

  • 32 Multitone - Spectrum.png
    32 Multitone - Spectrum.png
    247.4 KB · Views: 18

Sokel

Master Contributor
Joined
Sep 8, 2021
Messages
6,133
Likes
6,219
And here are the results with using the 3/4 headphone output and a split cable to both inputs in M/S mode.

View attachment 348214
View attachment 348215View attachment 348216View attachment 348218View attachment 348219View attachment 348220View attachment 348221View attachment 348222View attachment 348223View attachment 348224View attachment 348225View attachment 348226View attachment 348227View attachment 348228View attachment 348229View attachment 348230


Crosstalk is worse then with XLR, which is expected but at least it's pretty constant.

I will have to throw together an adapter for XLR to properly test the full range. But I don't think I will be seing numbers below the 120s with this unit like I have seen with some others.
Can you repeat the IMD vs level with DSD signal?
It seems that it disappears in my DAC (which is rocket high in PCM) but it would be nice to see what's happening in other ESS DACs.
 
OP
pkane

pkane

Master Contributor
Forum Donor
Joined
Aug 18, 2017
Messages
5,712
Likes
10,406
Location
North-East
Ok I got going (kind of) on a windows 11 machine (not VM). There are still some issues with the THD+N measurement as the program always gets stuck at some point when doing the measurement. Mostly it's on the "waiting" part. Other measurements run fine.

Only works with WASAPI, with ASIO drivers the test plan doesn't run at all. Only executes the first measurement and then stops.

Anyways, here are the results with single channel measurement with a single XLR cable on +24dBu on both in and output with -0.5dB on the output as to not clip.


View attachment 348198


View attachment 348199


View attachment 348200View attachment 348201
View attachment 348202View attachment 348203View attachment 348204View attachment 348205View attachment 348206View attachment 348207View attachment 348208View attachment 348209View attachment 348210View attachment 348212View attachment 348211


I think these numbers look OK, but there are twothings standing out to me:

1) Crosstalk seems a bit high?
2) IMD has a pretty high hump, even exceeding THD+N at one point. I don't see this in other measurements?

VMs aren't very good for running measurements, since their CPU is "virtual" and shared with the host O/S and other processes. Frequent interrupts, such as the need to back up memory and disk changes to physical hard disk of the host O/S also cause delays and interrupt a real-time measurement. Almost none of the ASIO drivers work in VM environment, I found one or two that sort-of work, on occasion. Again, just the limitation of a VM environment.
 

Ratterbass

Member
Joined
Jan 14, 2024
Messages
6
Likes
4
VMs aren't very good for running measurements, since their CPU is "virtual" and shared with the host O/S and other processes. Frequent interrupts, such as the need to back up memory and disk changes to physical hard disk of the host O/S also cause delays and interrupt a real-time measurement. Almost none of the ASIO drivers work in VM environment, I found one or two that sort-of work, on occasion. Again, just the limitation of a VM environment.
That’s why I used an actual windows machine and not a VM. i used a windows 11 PC with Ryzen 3400G and 16 gig RAM. Not the most powerful but should be sufficient.
 
OP
pkane

pkane

Master Contributor
Forum Donor
Joined
Aug 18, 2017
Messages
5,712
Likes
10,406
Location
North-East
That’s why I used an actual windows machine and not a VM. i used a windows 11 PC with Ryzen 3400G and 16 gig RAM. Not the most powerful but should be sufficient.
Strange that ASIO didn't work. You said only one measurement runs using ASIO, and then stops? Can you try executing each step in the test plan, individually, but in sequence, to see what happens?
 

Music1969

Major Contributor
Joined
Feb 19, 2018
Messages
4,676
Likes
2,850
The only measurement that's was done the old-fashioned (manual) way is the filter frequency response.
hi @pkane

What are all your settings for frequency response measurement?

i want to try to replicate for my DAC
 

DrCWO

Active Member
Audio Company
Forum Donor
Joined
Nov 14, 2020
Messages
269
Likes
371
@pkane thank you for all the work!
I‘m not able to test it yet but will do if I‘m back home end of April.

What I did not understand until now: Did you have already developed a script that delivers the same tests as @amirm runs so the results will be 1:1 comparable. I think in terms of measurement bandwidth for example.

Edit:
One more question. Using different devices for DA and AD this will result in a clock drift and therefore in a phase shift over time. How this is addressed in your software?

Best DrCWO
 
Last edited:
OP
pkane

pkane

Master Contributor
Forum Donor
Joined
Aug 18, 2017
Messages
5,712
Likes
10,406
Location
North-East
@pkane thank you for all the work!
I‘m not able to test it yet but will do if I‘m back home end of April.

What I did not understand until now: Did you have already developed a script that delivers the same tests as @amirm runs so the results will be 1:1 comparable. I think in terms of measurement bandwidth for example.

Edit:
One more question. Using different devices for DA and AD this will result in a clock drift and therefore in a phase shift over time. How this is addressed in your software?

Best DrCWO

The script I posted here is probably close to what Amir is measuring. It wasn't meant to duplicate exactly what he does, but where it made sense, I kept similar settings, including bandwidth for this particular test plan. You can take my (or any other) test plan and adjust it to your liking, or build your own with little effort and no coding. I call it "test plan building by example" :) You set up a measurement you like, then push one button to add it to the test plan. Do this for as many measurements as you want, fine-tune settings as needed in the Test Plan editor, then run the plan. Or load an existing test plan, like the one I shared here, and then use it as is, or modify it to your liking.

Clock drift is measured and displayed, but not corrected for in MTA. Phase measurements can be affected when two separate clocks are used, but almost all other measurements will be just fine with the use of a proper FFT window. When phase measurements are important or clock drift is really large, you'll want to sync the DAC and ADC clocks.
 
Top Bottom