OP
- Thread Starter
- #61
Thanks !
I re-ran the DIM30 test
It looks better, indeed.
View attachment 275887
I still can't zoom in the Waveform, though
So what do you use to zoom in and what happens when you try?
Thanks !
I re-ran the DIM30 test
It looks better, indeed.
View attachment 275887
I still can't zoom in the Waveform, though
is it possible to carry out this mode of plan... but or each measurement is stored in mode data being able then reprocessed a posteriori? like in for example just visual formatting?
("dats" ;-) )
would also seem quite logical with the particularity of the approach of M-T
(ps
nobody is fooled.. it is the practice of the race for figures, to display, which led to ""running so close to 0dbfs""(and ""asr"" has a lot to do with it at 0.1db of sinad ;-) )and not a reasonable and very useful systematic headroom... ;-) )
Not sure what you mean. IMD DIN Sweep is indeed a sweep vs level. Is this not correct?ps there are still some measurement titles that do not match ...
basic d imd becoming log sweep etc.
little things to "clean" as you go
;-)
") The good thing is you can share the test plan with others so that the same tests can be repeated elsewhere, and possibly with different equipment for comparison (like @Rja4000 and @Sokel have done already).
The good thing is you can share the test plan with others so that the same tests can be repeated elsewhere, and possibly with different equipment for comparison (like @Rja4000 and @Sokel have done already).Yes of course. I meant some designers have worked out how to solve the hump (years ago)And there're many with it.
I wonder if the IMD hump comes from the ADC
Because I've seen many DACs using 9038Q2M without the ESS hump
Cheap Pro-ject Pre Box S2 for example (designed by John Westlake years ago)
View attachment 275906
Fair callCompare that curve with PK's IMD one. With 10 dB higher noise or THD or both the hump is buried and simply no longer visible...
thank youSure, the test plan allows for this. You can add a pause before or after the each measurement, with a specific message (reminding you what you might want to do):
View attachment 275939
Pause Before lets you reconfigure any hardware or software settings that you can't already do in MT before the measurement.
Pause After lets you format, zoom in, change colors, title, fonts, etc. before the measurement is captured into an image.
thank you
I am talking about basic non-sweep imd tests...not what comes from your proposal
;-)
and was talking about a systematic storage of the raw data of each test and not just the image, to be able to later rework their presentation etc. see them exchanged.. etc.
a certain well-known realizes it ;-)
??
etc
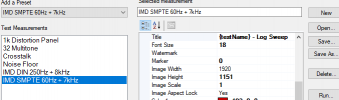
the name... does not correspond at all if not corrected
but not so important
;-)
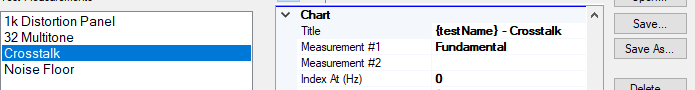
but this one is ok
etc etc
That's not quite what I'm talking about.
but
"chart
(test name)-**********"
;-)
Which highlights the importance of having a reference to compare to on the plots.Compare that curve with PK's IMD one. With 10 dB higher noise or THD or both the hump is buried and simply no longer visible...


 - Freq Response.png")
 - Impulse.png")
 - Phase.png")


I used this to test my motherboard loopback (realtek 1220-VB) to see how it stacks up against the fancypants RME ADI. Not as bad as I feared, though there's a lot more noise which dominates the results. (This is with the previous version.)
I have both ASIO4All and ASIOFlex installed, but couldn't see how to open the control panel for those. Direct Sound was a bust, with the program crashing on the Linearity test. But WASAPI seemed to work fine. Before running the test I roughly adjusted speaker and input levels in the Realtek control panel to get the best result in the 1kHz distortion panel.
View attachment 276011
View attachment 276012
View attachment 276013
View attachment 276014
View attachment 276015
View attachment 276016
View attachment 276017
View attachment 276019
View attachment 276020
View attachment 276021
View attachment 276022
View attachment 276023
View attachment 276024
View attachment 276025
View attachment 276026
@pkaneWhich highlights the importance of having a reference to compare to on the plots.
@pkane
Another idea:
You export a screen snapshot, which is good.
Why not to export also the measurements in a txt or XML file ?
Then we could easily build a graph that includes several measurements, for comparison.
(As an example, in Excel)
Or we could share them for others to use them as reference.
And, obviously, being able to attach such a result file to the tool for a measurement would also allow you to plot the 2 on the same graph.
(Warning: I can be quite creative as for tool development idea)