• WANTED: Happy members who like to discuss audio and other topics related to our interest. Desire to learn and share knowledge of science required as is 20 years of participation in forums (not all true). There are daily reviews of audio hardware and expert members to help answer your questions. Click here to have your audio equipment measured for free!

RME ADI-2/4 Pro SE - Auto-measured with Multitone

charleski

Major Contributor
Joined
Dec 15, 2019
Messages
1,098
Likes
2,218
Location
Manchester UK
Ok, I came across an oddity.
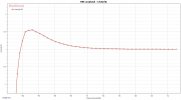
Although I hadn't set the zoom levels properly when saving results, I did notice that the Linearity result for my motherboard from the test plan seemed really good. So I repeated it as a single test (I set averages to 32, same as the test plan, if that means anything). This time I got a far worse (though still marginally acceptable) result:
MB Loopback - Linearity-single.jpg
I.e. linear (+/- 0.5dB) to -96dB: -alright but not great.
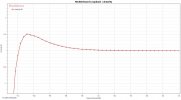
But I then repeated the linearity test in the test plan and it came out a lot better:
MB Loopback - Linearity-plan.jpg
Now it's linear down below -104dB!

Levels were the same, and I couldn't see anything in the test plan settings that was different to those for the single test. What could be causing the difference?
 
OP
pkane

pkane

Master Contributor
Forum Donor
Joined
Aug 18, 2017
Messages
5,287
Likes
9,529
Location
North-East
Ok, I came across an oddity.
Although I hadn't set the zoom levels properly when saving results, I did notice that the Linearity result for my motherboard from the test plan seemed really good. So I repeated it as a single test (I set averages to 32, same as the test plan, if that means anything). This time I got a far worse (though still marginally acceptable) result:
View attachment 276233
I.e. linear (+/- 0.5dB) to -96dB: -alright but not great.
But I then repeated the linearity test in the test plan and it came out a lot better:
View attachment 276234
Now it's linear down below -104dB!

Levels were the same, and I couldn't see anything in the test plan settings that was different to those for the single test. What could be causing the difference?

I think the linearity measurement I added to the test script used Coherent averaging instead of standard, Amplitude average. Try changing it for a non-test-plan test to Coherent to see if that's what makes the difference. Coherent averaging removes more of the noise from the linearity calculation, producing a cleaner result.
 

charleski

Major Contributor
Joined
Dec 15, 2019
Messages
1,098
Likes
2,218
Location
Manchester UK
I think the linearity measurement I added to the test script used Coherent averaging instead of standard, Amplitude average. Try changing it for a non-test-plan test to Coherent to see if that's what makes the difference. Coherent averaging removes more of the noise from the linearity calculation, producing a cleaner result.
Yeah, that's it. Switched to Coherent and I get the better result on single tests.
 
OP
pkane

pkane

Master Contributor
Forum Donor
Joined
Aug 18, 2017
Messages
5,287
Likes
9,529
Location
North-East
@pkane
Another idea:
You export a screen snapshot, which is good.
Why not to export also the measurements in a txt or XML file ?
Then we could easily build a graph that includes several measurements, for comparison.
(As an example, in Excel)

Or we could share them for others to use them as reference.

And, obviously, being able to attach such a result file to the tool for a measurement would also allow you to plot the 2 on the same graph.

(Warning: I can be quite creative as for tool development idea)

Not an XML but an HTML table is now generated as part of the test plan execution to document all the results:

https://www.audiosciencereview.com/...loopback-analyzer-software.27844/post-1552755

And, this version also lets you group multiple results on the same plot (and in the same table with multiple columns) using groups.
 
Top Bottom