• WANTED: Happy members who like to discuss audio and other topics related to our interest. Desire to learn and share knowledge of science required. There are many reviews of audio hardware and expert members to help answer your questions. Click here to have your audio equipment measured for free!

Klipsch RP-600M Speaker Review

ThoFi

Active Member
Joined
Aug 15, 2021
Messages
224
Likes
75
I am trying to say that the RP600M are not that bad as many others here did post.
Yes, they are not perfect but look at the price.
@ Jim Shaw: one additional comment about your hearing loss comment. So, referring to your comment amir should stop doing listening tests because I guess he is not in his 20s anymore ;)
 

Nwickliff

Active Member
Joined
Dec 3, 2020
Messages
235
Likes
204
I am trying to say that the RP600M are not that bad as many others here did post.
Yes, they are not perfect but look at the price.
@ Jim Shaw: one additional comment about your hearing loss comment. So, referring to your comment amir should stop doing listening tests because I guess he is not in his 20s anymore ;)
What we're trying to say is that your charts aren't showing anyone anything. Post them all you want, but don't try and use them to make an argument because they don't actually show anything. Post them with 5db increments per line and with a scale of 40-50 db, not 100db. It's like saying the earth is freaking flat because you can look out and see a flat horizon. With that vantage point (graph with so little detail) it's impossible to tell what you're looking at.

You have a 12db swing from 1k to 1.5K That's huge but you can't even tell by looking at your graph.

The point of a visual representation of something (a graph) is to be able to look at it (WITHOUT COUNTING LINES) and see what's going on. you've got a 22db dip from 100hz to 130hz in your room as well. That's a crazy deep suckout. Here's what your measurement looks like at 50db scale.
 

Attachments

  • 50db Scale.png
    50db Scale.png
    192.7 KB · Views: 104
Last edited:

ernestcarl

Major Contributor
Joined
Sep 4, 2019
Messages
3,113
Likes
2,330
Location
Canada
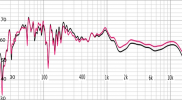
As others already mentioned, when taking an image capture snapshot in REW, try to set a 50 dB vertical scale limit to make your graphs more visually comparable. A +- 10 dB leeway is fine, too. And if you want even more consistency regardless of the vertical scale limit, you could also use a fixed 25 dB/decade graph aspect ratio -- although, I often skip that step in order to save space.

I think it's obvious that these speakers will require EQ even with the horn waveguide. Realistically, there will still be an effect coming from the room, but much, much less so... Below the transition zone, the room dominates so we can't really criticize him about it too much. C'mon... I'm sure we've seen worse rooms and MLP measurements than this.

Incidentally, I'd be curious to see some frequency dependent windowing (say, 5-7 cycles) applied to see what the "direct sound" is like when the the rest of the later arriving, reflected energy is filtered out. Some speakers' frequency response magnitude trace, when placed well beyond the critical distance in an untreated room, appear to utterly "collapse" when FDW is applied -- almost seems like the speakers are broken -- but, no, they're usually not.

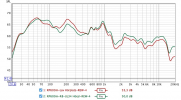
Still, one can get a good enough sound, of course... but there will be lots of added "room sound" ambience/coloration. Equalization through speaker amps and uncontrolled room reverb is not what I would call desirable if fidelity to the source were a top priority.
 

ThoFi

Active Member
Joined
Aug 15, 2021
Messages
224
Likes
75
What we're trying to say is that your charts aren't showing anyone anything. Post them all you want, but don't try and use them to make an argument because they don't actually show anything. Post them with 5db increments per line and with a scale of 40-50 db, not 100db. It's like saying the earth is freaking flat because you can look out and see a flat horizon. With that vantage point (graph with so little detail) it's impossible to tell what you're looking at.

You have a 12db swing from 1k to 1.5K That's huge but you can't even tell by looking at your graph.

The point of a visual representation of something (a graph) is to be able to look at it (WITHOUT COUNTING LINES) and see what's going on. you've got a 22db dip from 100hz to 130hz in your room as well. That's a crazy deep suckout. Here's what your measurement looks like at 50db scale.

here the closer zoom.
I am looking forward to your analysis


1645455701188.png

1645455732112.png


1645455763751.png


1645455792187.png
 

Attachments

  • 1645455830689.png
    1645455830689.png
    202.6 KB · Views: 45

ThoFi

Active Member
Joined
Aug 15, 2021
Messages
224
Likes
75
very interesting my Harbeth SHL5 40An did also show huge dips from 1,5kHz to 3kHz.....!!???
approx the same magnitude compared to the klitsch

1645463717166.png

1645463755193.png


1645463799177.png

1645463830738.png
 

ThoFi

Active Member
Joined
Aug 15, 2021
Messages
224
Likes
75
What information are you after? So much has already been discussed in this thread. The info is right there in your graph.

Ah, ok. And I thought you do need a closer zoom to be able to analyze the measurements…???
 

Eetu

Addicted to Fun and Learning
Forum Donor
Joined
Mar 11, 2020
Messages
763
Likes
1,180
Location
Helsinki
Ah, ok. And I thought you do need a closer zoom to be able to analyze the measurements…???
Well your in-room measurements do show the same ~6dB dip centered around 1700Hz as Amir's Klippel data predicts so no surprises there.
 

ernestcarl

Major Contributor
Joined
Sep 4, 2019
Messages
3,113
Likes
2,330
Location
Canada
very interesting my Harbeth SHL5 40An did also show huge dips from 1,5kHz to 3kHz.....!!???
approx the same magnitude compared to the klitsch

View attachment 188239
View attachment 188240

View attachment 188241
View attachment 188242

Exact same speaker and listener position? I would have expected a more similar response below 500Hz.

If you’re still not planning on investing in EQ, then probably better off getting a different speaker with more favorable in-room response — unless switching between amps is already sufficient enough a solution for your own needs.

But, to me, your graphs with the different amps aren’t particularly inspiring confidence. More could be done to shape the sound to better broadly fit one’s own liking via digital EQ.
 

ThoFi

Active Member
Joined
Aug 15, 2021
Messages
224
Likes
75
Exact same speaker and listener position? I would have expected a more similar response below 500Hz.

If you’re still not planning on investing in EQ, then probably better off getting a different speaker with more favorable in-room response — unless switching between amps is already sufficient enough a solution for your own needs.

But, to me, your graphs with the different amps aren’t particularly inspiring confidence. More could be done to shape the sound to better broadly fit one’s own liking via digital EQ.

yes, exactly the same speaker and listening position.
And I did some EQ at the frequencies below 300Hz.
Here a image with and without EQ to fix some room modes. Different filters and „correct“ scaling I will share later today.

1645500977882.jpeg
 
Last edited:

ThoFi

Active Member
Joined
Aug 15, 2021
Messages
224
Likes
75
see the measurements of the Harbeth with different filter and scaling. a €5.500 speaker! (now the XD version €6.250)
Aren't there also huge dips and peaks etc..?
Are the Harbeth also crappy speaker and horrible to listen to??
Are they any better than the Klipsch?
ASR, please help and explain.
Thanks!

1645551769504.png

1645551798928.png

1645551839935.png

1645551868807.png
 
Last edited:

Eetu

Addicted to Fun and Learning
Forum Donor
Joined
Mar 11, 2020
Messages
763
Likes
1,180
Location
Helsinki
see the measurements of the Harbeth with different filter and scaling. a €5.500 speaker! (now the XD version €6.250)
Aren't there also huge dips and peaks etc..?
Are the Harbeth also crappy speaker and horrible to listen to??
Are they any better than the Klipsch?
ASR, please help and explain.
Thanks!

View attachment 188460
View attachment 188461
View attachment 188462
View attachment 188463
You have to understand this is what happens when you place loudspeakers in a regular room. There's room modes (probably the cause of your ~30 & 56Hz peaks), SBIR cancellations (front wall likely causing the 100Hz dip), floor and ceiling bounce and all sorts of other comb filtering.

The response looks worse than it sounds since we can to a certain extent hear 'through' the room. The graph shows all the reflections since that's what the mic picks up but our brains prioritize more of the direct sound. And that direct sound is what can be seen on the ASR measurements. Your in-room measurements show the anechoic speaker response combined with the speaker-room interaction.

If your speaker is this one it's very good on-axis, don't worry about it.
 

ernestcarl

Major Contributor
Joined
Sep 4, 2019
Messages
3,113
Likes
2,330
Location
Canada
see the measurements of the Harbeth with different filter and scaling. a €5.500 speaker! (now the XD version €6.250)
Aren't there also huge dips and peaks etc..?
Are the Harbeth also crappy speaker and horrible to listen to??
Are they any better than the Klipsch?
ASR, please help and explain.
Thanks!

Assuming you know how to read measurements sufficiently, and relate them to your own personal biases and listening test experience, then you should be able make up your own conclusions. If you like and enjoy the Harbeth and Klipsch speakers you have the same, then that's all the justification you really need.

But if you are asking if there are better measuring and/or sounding speakers out there at cheaper cost? The answer is, of course, also an obvious yes!
 

ThoFi

Active Member
Joined
Aug 15, 2021
Messages
224
Likes
75
You have to understand this is what happens when you place loudspeakers in a regular room. There's room modes (probably the cause of your ~30 & 56Hz peaks), SBIR cancellations (front wall likely causing the 100Hz dip), floor and ceiling bounce and all sorts of other comb filtering.

The response looks worse than it sounds since we can to a certain extent hear 'through' the room. The graph shows all the reflections since that's what the mic picks up but our brains prioritize more of the direct sound. And that direct sound is what can be seen on the ASR measurements. Your in-room measurements show the anechoic speaker response combined with the speaker-room interaction.

If your speaker is this one it's very good on-axis, don't worry about it.

I am aware of room modes and direct sound.
I think that an anechoic measurement could not tell you how a speaker really sounds in a real room and you can’t blame a speaker based on these measurements.
In room measurements do show direct and reflected frequencies, of course.
How to see what is direct and what is reflected? Need of extended measurements…
Beside that we can say that, the lower frequencies are ‚direct sound‘ (direct and reflected energy is nearly equal) and at higher frequencies (at a certain f) is getting more and more direct.
So, referring to anechoic measurement compared to my Harbeth real room measurements.
The low frequencies you can’t predict the in room performance, nearly equal direct and reflected energy.
The mid frequencies, the dip 1.5-3kHz, you can’t predict, also nearly equal direct and reflected energy, because I assume this frequencies will not be radiated like a beam.

So to me you can’t tell and judge a speaker by its anechoic measurements. Maybe true at highest frequencies.
And the anechoic measurements tells you nothing about dynamics.
 
Last edited:

Eetu

Addicted to Fun and Learning
Forum Donor
Joined
Mar 11, 2020
Messages
763
Likes
1,180
Location
Helsinki
The mid frequencies, the dip 1.5-3kHz, you can’t predict, also nearly equal direct and reflected energy, because I assume this frequencies will not be radiated like a beam.

So to me you can’t tell and judge a speaker by its anechoic measurements. Maybe true at highest frequencies.
And the anechoic measurements tells you nothing about dynamics.
Assuming your speakers are the same/similar model as measured in Stereophile.. JA says: "In the vertical plane, a suckout centered at 2.5kHz develops more than 5° above and below the upper tweeter axis." And if you look at the horizontal directivity you can see that there's a "lack of energy at extreme off-axis angles just below the crossover to the tweeters". XO being 3.2KHz.
IMG_20220223_070059.jpg

They have clearly prioritized on-axis performance but the directivity is not great. So in a way opposite what the RP-600M is doing (poor FR but can be EQ'd effectively due to very good directivity). But this is getting way off-topic. Feel free to create a new thread or look for relevant existing threads if you'd like to continue the in-room measurements vs anechoic measurements discussion.
 
Last edited:

Tangband

Major Contributor
Joined
Sep 3, 2019
Messages
2,994
Likes
2,799
Location
Sweden
This loudspeaker with a mini-dsp and two Aiyima a07 could turn out to be a good active loudspeaker. The mod is very easily made because of the twin crossover inputs. Just take out the passive crossover and throw it away. Passive crossovers with metal bassdrivers is a pain to get right, demanding 24dB slopes.
 
Last edited:

ernestcarl

Major Contributor
Joined
Sep 4, 2019
Messages
3,113
Likes
2,330
Location
Canada
So to me you can’t tell and judge a speaker by its anechoic measurements. Maybe true at highest frequencies.

The point you’re trying to get across has been pretty much discussed ad nauseam elsewhere, including Toole’s book on sound reproduction. A single frequency response graph is just that: a single view of information. One has to fill in the rest of the picture with other data points. The best single graph view we have at the moment is the spinorama — but most educated viewers should already know it does not contain other info like dynamic limiting/compression and distortion… nor describes the pure transfer function fully as it’s inevitably mangled and modified inside a room, along with the rest of the stuff that’s in the signal chain — tube amps vs your solid state amps, DSP EQ etc.

If you want to share a more complete picture of your speaker playback comparison exercises (blind or sighted), better start a new thread and post all relevant information there…
 

TurtlePaul

Addicted to Fun and Learning
Joined
May 19, 2020
Messages
632
Likes
1,030
Location
New York
yes, exactly the same speaker and listening position.
And I did some EQ at the frequencies below 300Hz.
Here a image with and without EQ to fix some room modes. Different filters and „correct“ scaling I will share later today.
Now that you are using EQ on the Klipsch, why not try to remove the suck out that the spinorama measured? Try adding a parametric filter of Freq = 1,900, Gain = +5.0 dB, Q = 1.8. That should be pretty close to making the speaker flat on-axis. Then point the speakers directly at your listening position. Do you like the sound better? Worse? I would think female vocals would be the most distinct in that range.
 

Jim Shaw

Addicted to Fun and Learning
Forum Donor
Joined
Mar 16, 2021
Messages
616
Likes
1,160
Location
North central USA
I definitely say that the RP600m are not to bright.
Why you say others may have hearing loss?? Do you know that? Your hearing is ok?? How old are you?
Today I listen to some orchestra string section. Really not bright at all.
To be honst I am surprised that the Klipsch did sound that good…
The careful measurements say they're too bright. As do my ears. Subjective opinions are like opposing thumbs; most everyone has two.
 
Top Bottom