
bennybbbx
Addicted to Fun and Learning
This waterfall plot?
I want to point out that instead of telling yourself "I don't know" and just asking, you are inventing reasons.
The messiness is because the graph is not anechoic. The low frequencies are noise in Amir's garage, and the rest are related to resonances of Klippel fixture.
Amir does a poor job of presenting this plot, using inconsistent axes and 3D position/rotation, and furthermore he is aware of Klippel resonances, but never distinguishes between them and speaker resonances in his commentary or labels. I generally ignore it. If there are actual speaker issues they show up in the on and off-axis curves.
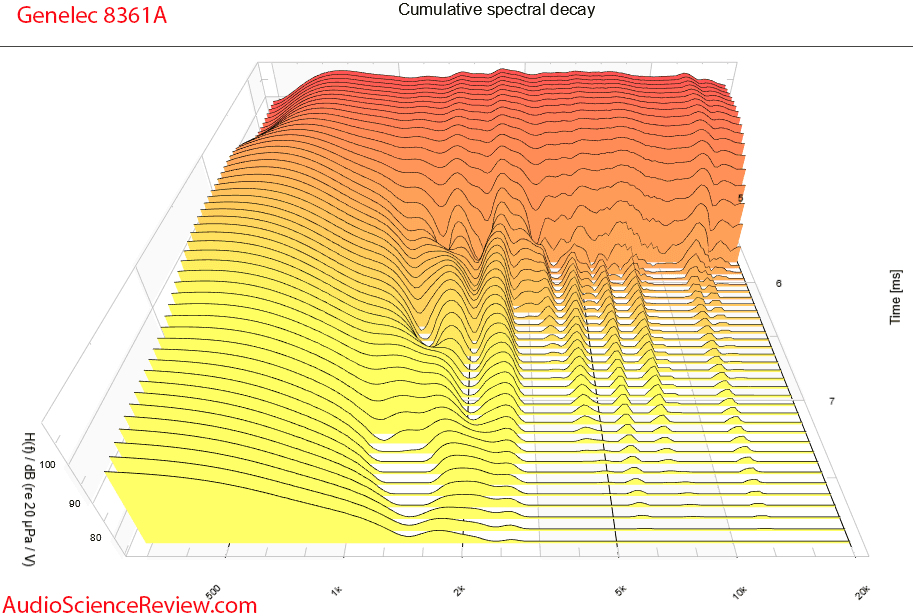
I think @amirm can try 1 test(I mean not all speaker tests) how the spectral decay change depend on volume the measure is. same speaker at 80 db 86 db 96 db 105 db spectral decay show. My guess is it change alot. normal foam below is too soft, can cause resonances too . melamin is stronger as foam or maybe try speaker decoupling feet as this https://alphahighend.be/en/categorie-produit/furniture-decoupling/spikes/ . the genelec is measure with over 100 db and it is very slow decay. see also the time the genelec plot begin. at 5 ms. here is a decay with a 85 db measure. the plot begin with 0.5 ms and it look much better. https://www.audiosciencereview.com/...l-4312m-ii-3-way-studio-monitor-review.51226/ or here also a low volume spectral https://www.audiosciencereview.com/forum/index.php?threads/human-speakers-81-dk-review.50915/

