OP
Balle Clorin
Major Contributor
- Joined
- Dec 26, 2017
- Messages
- 1,364
- Likes
- 1,237
- Thread Starter
- #781

The record polar plot wavy pattern is around 8 peaks, about 4 Hz. Is that seen also for the Denon and gyro? i don’t remember.From the DD drive I guess
Thanks,This is typical for a direct drive.
It is called pole cogging. I'm not sure whether it is a 4 or 8 pole motor.
Here is one measured with a gyroscope (16-pole?):
View attachment 313588
The Gyro does not have the 4.4Hz but other Hz, the same 4.4 occurs on Clearaudio and B&K and Tacet test on the denon 51FThe record polar plot wavy pattern is around 8 peaks, about 4 Hz. Is that seen also for the Denon and gyro? i don’t remember. Gyro
 audiosciencereview.com
Yes, I think I get that.But what confuses me is that quasi-peak also is called weighted-peak as DIN standard says. So what is your DIN figures? Quasi-peak with and without the weight curves? "DIN linear" give me clues as it is just peak and not quasi-peak.Weighting (in the frequency domain) means:
View attachment 313599
and unweighted:
View attachment 313600
Quasipeak in the time domain means:
A fast attack time (e.g. 31ms) and slow decay time (e.g 1000ms) is used to emphasize the peaks. Nowadays the 2sigma method is recommended (all newer standards refer to that).
Thanks! So the it is so that DIN quasi peak (linear) usually is a bit higher than 2sigma.DIN measurements are quasi peak.
One with the weighting curve with a peak at 4Hz and the other with 0,2...200Hz (-3dB) (linear)
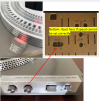
Sony PS-212. Thanks, I only adjusted the internal 45rpm and 33rpm trimmers to get the front panel trimmer within normal range, and strobes stationary in center position.The file names describe the steps. But the 5th shows the effects of misadjustment. As I can't measure the amplitude correctly, the 6th is adjustment was made by eye. The lissajous figure doesn't reach 15V. I need to figure out a solution to my problem. I realize this is likely the most amateur fail anyone can have, lol. Could what you are seeing on the Sony be related to a trim pot setting being off?
All the text seem to be the same to me---?The file names describe the steps.
audiosciencereview.com
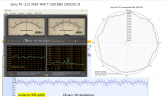
During my unanticipated forced downtime that afforded me the window to write the script to facilitate these measurements and plots. These are laser displacement measurements of an SP-10MKII platter, taken from about 1cm in from the platter lip, spinning under its own power. This is an early unit that I imported from Japan 2-3 years ago. It shows signs of being stored in a slightly unfavorable environment. The motor is untouched.
The max deviation is 0.07623mm / 0.0030" over four revolutions. It's 0.09152mm / 0.00360" over 200 revolutions. Time permitting I'll measure it with a cartridge on a cut-down record, and repeat all measurement after servicing the motor. And, of course, measure a few more units.
For giggles, the second plot superimposes four revolutions of what I'd consider a rather flat record. Max deviation is 0.33559mm / 0.01321". Platter and record measurement are not indexed.
View attachment 314456
View attachment 314457