• WANTED: Happy members who like to discuss audio and other topics related to our interest. Desire to learn and share knowledge of science required. There are many reviews of audio hardware and expert members to help answer your questions. Click here to have your audio equipment measured for free!

Fun with vinyl measurements


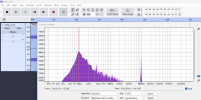
Please use REW, Audacity often fail to present frequency responses correctly

Please measure the sample, using the REV program for both channels, where you can see, in numbers:

1. What is the highest amplitude of the test signal.

2. What is the highest amplitude of the unwanted resonance in the range of 0 to 20 Hz, and at what frequency did the peak of the amplitude of the unwanted resonance occur.

Sample test:
 
but reading you..not a """resonance"""...
but then there can be elements in resonance with the present frequency... so manage the source... ;-)
I use only Google Translator.

I wanted to measure the amplitude level of unwanted resonance in the range of up to 20Hz which always occurs in the case of a turntable.
Unfortunately, it is unavoidable.
As a reference point, I used the level of the test signal of 1 kHz.
 
Please measure the sample, using the REV program for both channels, where you can see, in numbers:

1. What is the highest amplitude of the test signal.

2. What is the highest amplitude of the unwanted resonance in the range of 0 to 20 Hz, and at what frequency did the peak of the amplitude of the unwanted resonance occur.

Sample test:
It's about -30.2 dB @ 11.5 Hz vs. dBr 1 kHz (0).

test.png
 
plotting 1khz file posted above in Audacity...
1736105440920.png

plotting in REW
1736105258387.png


Why does Audacity always misrepresent the data when I try to use it. ?
 

Attachments

  • 1736105216312.png
    1736105216312.png
    209.2 KB · Views: 29
Last edited:
plotting 1khz file posted above in Audacity...
View attachment 418918
plotting in REW
View attachment 418914

Why does Audacity always misrepresent the data when I try to use it. ?

From your REW graph I can't see what the test signal level is, I can't see what the unwanted resonance level is in the range of 0-20 Hz

I need to easily measure this to know what the peak amplitude of the unwanted resonance is in relation to the peak of the test signal
 
From your REW graph I can't see what the test signal level is, I can't see what the unwanted resonance level is in the range of 0-20 Hz

I need to easily measure this to know what the peak amplitude of the unwanted resonance is in relation to the peak of the test signal
You can do that with the cursor in REW. While noise is a bit jagged, one can use smoothing to go for the LF peak.
 
CA-TRS1007
Analysis of the test signals used on this forum to measure the frequency response of a phono cartridge. Removed the 1 kHz pilot, removed the gap between the test signals.

You can see that in addition to playing the 20-20 kHz test signal, the phono cartridge genres a very high level of unwanted resonance in the range from 0 to 20 Hz, the peak is at about 11 Hz and the amplitude is very high, about 7-8 dB below the highest level of the test signal

The unwanted, undesirable charm of old technology :)
It's a good thing that most vinyl records don't record music at such low frequencies.

I'll have to do a test sometime, using the same test signals using a turntable cartridge with low compliance, e.g. for DJs on a tonearm with a high effective mass.

Adobe Audition

Adobe Audition.jpg


Audacity

Audacity.jpg


Audacity

Audacity_2.jpg
 
Last edited:
CA-TRS1007
Analysis of the test signals used on this forum to measure the frequency response of a phono cartridge. Removed the 1 kHz pilot, removed the gap between the test signals.

You can see that in addition to playing the 20-20 kHz test signal, the phono cartridge genres a very high level of unwanted resonance in the range from 0 to 20 Hz, the peak is at about 11 Hz and the amplitude is very high, about 7-8 dB below the highest level of the test signal

The unwanted, undesirable charm of old technology :)
It's a good thing that most vinyl records don't record music at such low frequencies.

I'll have to do a test sometime, using the same test signals using a turntable cartridge with low compliance, e.g. for DJs on a tonearm with a high effective mass.

Adobe Audition

View attachment 418939

Audacity

View attachment 418940

Audacity

View attachment 418941
Yes arm resonance is always there excited by the record. Audacity is however poor at spectrum analysis.

CA-TRS1007 L channel; Audacity - "resonance" ≈-18 dB down with the sweep.

Skärmavbild 2025-01-05 kl. 21.39.07.png


Same in REW, L channel + crosstalk. Look at the 0.55 Hz x n peaks.

REW.png
 
Yes arm resonance is always there excited by the record. Audacity is however poor at spectrum analysis.

CA-TRS1007 L channel; Audacity - "resonance" ≈-18 dB down with the sweep.

View attachment 418946

Same in REW, L channel + crosstalk. Look at the 0.55 Hz x n peaks.

View attachment 418947

I'll stick to Audacity measurements.
To be sure, do an analysis of both channels in Audacity.
You have a very good result, the resonance is 18 dB below the peak of the test file. The difference is very big.
What cartridge and tonearm were used?
I used a Technics 1200GR2 turntable and a used Ortofon MC 5000 cartridge.
I use the Moerch DP-8 and Shure V15Vx/JICO SAS/B. The Moerch is damped in the lateral motion and also have side-weights for higher inertia laterally. The Shure has the brush damper. It all helps to reduce the resonance, and secondary effects of it.
 
Rename this file to .cal and use it in REW as a calibration file to make pink noise appear flat in the plot

1736110879796.png


1736111007367.png

Pink noise form cartridge without 10db/decade correction file
1736111056389.png
 

Attachments

  • DENNE 0-48 96K.txt
    1.3 MB · Views: 31
I use the Moerch DP-8 and Shure V15Vx/JICO SAS/B. The Moerch is damped in the lateral motion and also have side-weights for higher inertia laterally. The Shure has the brush damper. It all helps to reduce the resonance, and secondary effects of it.
Yes Yes, 2 resonance suppression systems made a very big difference. A difference of about 10 dB is a lot.
 
Last edited:
I'll stick to measuring using Audacity.
I'll use the same signals for measuring as for measuring frequency response.
I think that for comparing different cartridges and different tonearms this will be enough for me.
 
Ortofon MC Jubilee (New) + Technics 1200GR2
The peak of the unwanted resonance is 10 dB below the peak of the test signal for measuring the frequency response of the phono cartridge, removed the 1 kHz pilot, removed the gap between the test signals.
The tonearm does not have any system for suppressing unwanted resonance, and the cartridge also does not have any external system for suppressing resonance.

Jubille_1.jpg


Jubille_2.jpg
 
Last edited:
@Balle Clorin

can you share your "fricatives" files from the Shure and AT?

I can't get better than this at ≈1.45 g (Shure V15Vx/SAS/B):

 
Audio Technica 95E (New) + Technics 1200GR2

The peak of the unwanted resonance is 9.4 dB dB below the peak of the test signal for measuring the frequency response of the phono cartridge, removed the 1 kHz pilot, removed the gap between the test signals.
The tonearm does not have any system for suppressing unwanted resonance, and the cartridge also does not have any external system for suppressing resonance.
A95E_1.jpg


A95E_2.jpg
 
Audio Technica 95E (New) + Technics 1200GR2

The peak of the unwanted resonance is 9.4 dB dB below the peak of the test signal for measuring the frequency response of the phono cartridge, removed the 1 kHz pilot, removed the gap between the test signals.
The tonearm does not have any system for suppressing unwanted resonance, and the cartridge also does not have any external system for suppressing resonance.
View attachment 419195


View attachment 419196

What is the point of these to anyone aside from you?
 
Please provide more measurements for comparison, using Audacity.

It is important that the measured test signal is 96 kHz, and the resolution in Audacity is set to 65,536

We measure test signals 1 and 2 from the CA-TRS 1007 disc.
We remove the 1 kHz pilot from both signals, and those fragments where there is no test signal
Thank you very much in advance.

It would be nice to see the measurement results, with the damping system used, and without the damping system used, in the turntable, and/or the turntable cartridge.


Clipboard_01-06-2025_01.jpg
 
That doesn't explain why you think it has any relevance to anyone else. You're showing the resonance with your arm, and you're using a flawed tool to do it.
 
Back
Top Bottom