- Joined
- Feb 23, 2016
- Messages
- 20,771
- Likes
- 37,635
Using 8 sweeps reduces the contribution of noise.


Yes this seems possible, different options selected on the chips perhaps - though another variable is the choice of output channel. I only used outputs 8 and 3 and inputs 8 and 3. I noticed no difference between inputs 8 and 3 but between outputs 8 and 3 there was a clear difference in the behaviour with low level sweeps in that the output was much more wiggly, whilst at high level they looked very similar (shorter wiggles). You used a main output presumably meaning output 1 or 2. There are maybe implementation differences with those outputs - I think they may be on the 2 channel DAC-only chip whilst the others are all on combined DAC/ADC ships. I think they have soft-start muting etc (though that seems unlikely to be a factor here).Maybe the filtering is different in the later 192 khz capable units. Even though the same chips are used.
Interesting. The horizontal axis is presumably time over which the sweep was performed, ie about 48 seconds overall? And relatively strong aliasing from frequencies 24-26kHz ?I sometimes record sweeps and view them in a spectrogram view in Audacity. This lets you see harmonic and intermodulation distortion, aliasing/imaging, and if bad enough jitter artifacts.
When I do that you can adjust the rate of the sweep vs the size of the FFT to minimize the effects of noise. You essentially are doing that with multiple sweeps and larger FFTs in REW. If you could lengthen the sweeps you could do it with smaller FFTs.
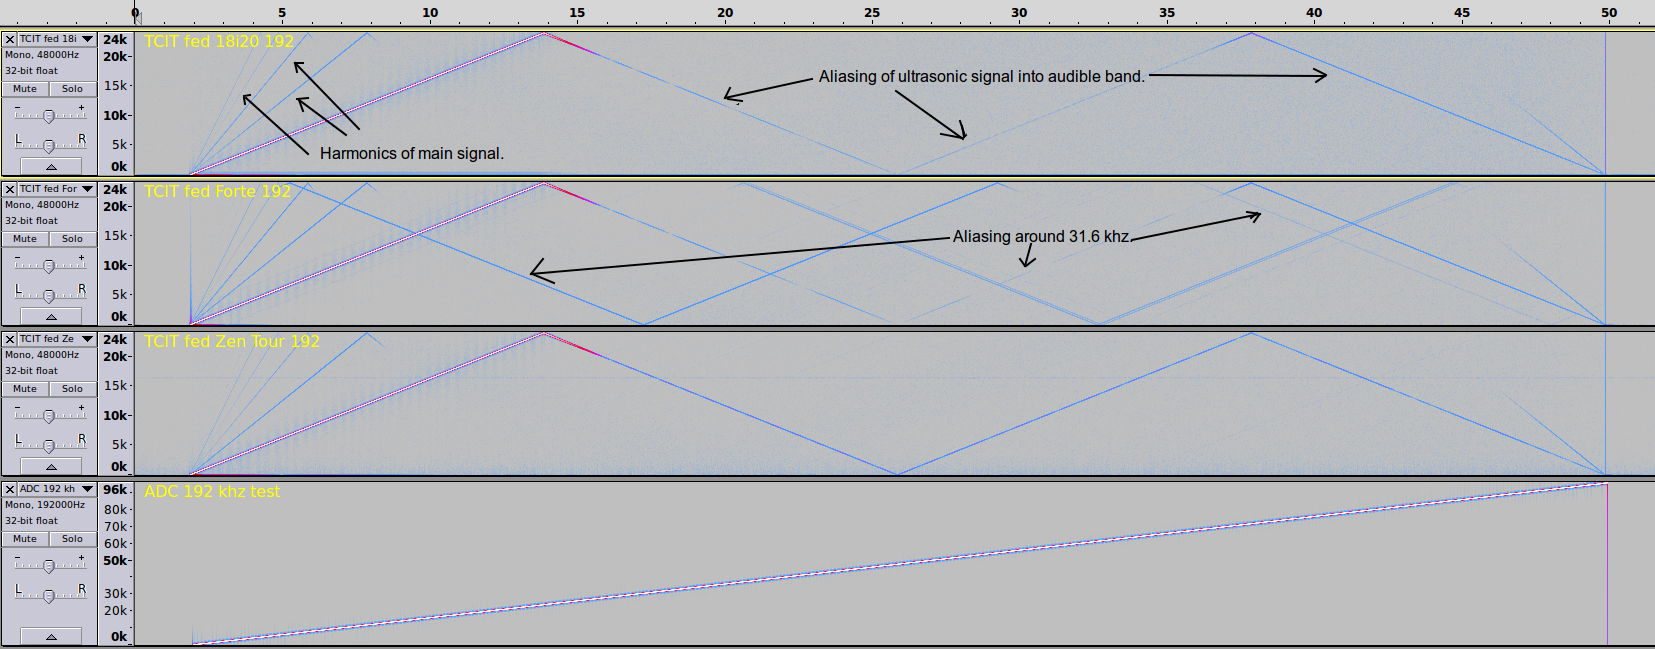
Here is an example where I did a sweep to 96 khz while recording at 48 khz. In this case the spectrogram was set to be light gray at -100 dbFS. You can change that and sometimes find other things. For instance the 18i20 has a series of tones spaced every 1000 hz all the way to the maximum frequency. These are down around -126 dbFS however.
?)(It is common to just omit part of the filter chain at higher sample rates, though in more modern parts this may only occur past 96 kHz.
Yes.Interesting. The horizontal axis is presumably time over which the sweep was performed, ie about 48 seconds overall? And relatively strong aliasing from frequencies 24-26kHz ?
")
How was this taken? Looks like REW RTA.. Is this just listening to an unconnected input, or is it listening to an output looped back to an input? And at what input gain level?Here are the 1 khz spurious tones in the 18i20. Lower level than I remembered.
View attachment 308282
Yes I selected doing 8 sweeps in the menu. And no FR wiggling is not effected by that. I do have another interface with rippled responses. It happens at all levels.@Blumlein 88 - Thanks for running those. Intriguing that you don't get any of the things I did at 44.1 though your 88.2 looks more similar to my result.
One small aspect: when you say you did 8 sweeps do you mean you did 8 separate sweeps and selected 'average the responses', or selected 8 as the number of repetitions in the measurement panel? I'm guessing the latter. I'll try it the same way as you did it as a sanity check.
The x8 will reduce the visibility of random noise compared to my single sweeps. If the maths is the same as increasing the sweep time (seems intuitively reasonable...) then it should have the effect of 3dB noise reduction for each doubling, so your plots should look 9dB less noisy than mine. The REW guidance said that to reduce noise effects it was generally better to use a single sweep but to make it longer, rather than to average repeated sweeps - but I forget the reason for the moment.
Anyway I don't think the low level wiggling is going to behave like random noise so it wouldn't account for that difference, not obviously anyway, and there is evidently an implementation difference - or faulty component perhaps - in my device to account for it varying consistently between outputs.
Anyway - please don't run any more tests on my account, ie. not unless you have your own interest in this too! It all takes time...
I had output 8 connected to input 1, but no signal going out. So listening using the RTA function. I've checked it with signal and it's still there.How was this taken? Looks like REW RTA.. Is this just listening to an unconnected input, or is it listening to an output looped back to an input? And at what input gain level?
cheers/Henry
On macOS REW uses the sample format specified in the Mac's Audio Midi Setup utility for the interfaces being used. There is no 16-bit limitation. REW cannot control the interface sample rate on the Mac so the rate in Audio Midi Setup should match the rate in REW otherwise the OS will resample.I am also unaware of REW's sound API limitations on the Mac. You may very well need to keep its sample rate sync'd with system settings. Not sure whether the same limit of 16 bit samples applies when using Java I/O, which is the case on Windows.
Thank you JohnOn macOS REW uses the sample format specified in the Mac's Audio Midi Setup utility for the interfaces being used. There is no 16-bit limitation. REW cannot control the interface sample rate on the Mac so the rate in Audio Midi Setup should match the rate in REW otherwise the OS will resample.
On Windows the JavaSound drivers are limited to stereo and 16-bit data and REW cannot control the sample rate. That is not the case for the WASAPI exclusive Java drivers (device entries whose names start EXCL) or ASIO drivers, for both of those REW uses the highest sample resolution the interface supports and configures the sample rate to match the rate chosen in REW.
The actual sample resolutions REW is using are shown at the bottom of the main window, along with a bit activity display for input data. Here is an example where the sample formats for input and output are both 32-bit but REW has detected that the input data is actually 24-bit, the bottom 8 bits are always zero.
View attachment 308514
@Blumlein 88 How did you make these measurements by the way? I'm interested in doing something similar for a couple of ADC's I have as well as the 2nd Gen 18i20.I sometimes record sweeps and view them in a spectrogram view in Audacity. This lets you see harmonic and intermodulation distortion, aliasing/imaging, and if bad enough jitter artifacts.
When I do that you can adjust the rate of the sweep vs the size of the FFT to minimize the effects of noise. You essentially are doing that with multiple sweeps and larger FFTs in REW. If you could lengthen the sweeps you could do it with smaller FFTs.
Here is an example where I did a sweep to 96 khz while recording at 48 khz. In this case the spectrogram was set to be light gray at -100 dbFS. You can change that and sometimes find other things. For instance the 18i20 has a series of tones spaced every 1000 hz all the way to the maximum frequency. These are down around -126 dbFS however.
Yes it was an Impact Twin. Mine is still working I just don't have any Firewire machines for it. I mostly use it in stand alone mode for karaoke parties.@Blumlein 88 How did you make these measurements by the way? I'm interested in doing something similar for a couple of ADC's I have as well as the 2nd Gen 18i20.
I take it this is using a TC Impact Twin as the DAC (I've had two of these in the past, 2nd replacing the first under retailers warranty, then the 2nd died in a similar time...).
Because of the alignment of the graphs it looks like the sweep was recorded along with spectrum, so how did you have two different sample rates running at the same time in the same system? Or was the test sweep recorded separately and aligned 'manually' here? (Recorded as a pre-run on the measurement machine at the higher sample rate?)
I've revived an old iMac which has an optical line out capability with which I can drive an 18-yr-old RME ADI2 as the sweep signal source. I guess this should be useable for the above kind of experiments. The output doesn't seem to go above 96kHz unfortunately so limited to sweeps up to 48kHz though this would seem enough to cover the most likely ultrasonic sources of aliasing in practice.
I haven't seen how to make a similar 'spectrogram over time' plot with REW. I'm not familiar with Audacity and I don't really want to have to familiarise with another piece of software if possible but if need be...
I've tried to come up with other ways of capturing aliasing using REW but none of them have seemed to be workable with REW so far. I thought of using bandwidth limited noise from say 20kHz to 48kHz, or a sweep from 20kHz upwards but the REW generator doesn't seem to allow me to do these. If it had worked then I planned to just compare the spectra up to 20kHz with and without the test ultrasonic signal input to see what if any new audible frequencies put their heads above the parapet.
Or can anyone point me to another / classic / standard way of looking for aliasing, ideally using REW, that I'm missing ?
Cheers/ Henry
I've tried to a few other ideas for