Class A “class D killer” amplifier with THD less than -120dB
Intro
6 years ago I built a low-power (high heat) class A amplifier, with very low distortion. It had true class A output stage with local negative feedback to reduce distortion and a global feedback network across the whole amplifier circuit. The power was not high, like 2x25W/4ohm or 2x13W/8ohm. However, a lot of heat
")
. The sound was fantastic. I was not able to measure distortion of that amplifier with my system limits, so I took it on my colleague's AP2712 where we made some basic measurements, but too little to give a whole view. The amplifier needed about 170VA at idle (true class A has highest power consumption at idle) and it heated the living room identifiably. The power was not high enough for all my needs, so after about 2 years of operation I have dismounted the casework and used it elsewhere, leaving the amplifier boards assembled and working.
Time after time I resurrect these boards, make some small modifications and measure them. Now I was provoked in further measurements by those simple and never ending amplifier SINAD debates. As many of you know, I am not a big friend of 1kHz/5W SINAD as a measure or rating of amplifier quality. I am deeply convinced that there are much more important parameters and that talking about amplifier SINAD higher than 100dB is completely pointless. This is based on my more than 40 years long experience as a circuit designer and system designer and 50+ years of interest in audio circuits.
However, if you want it ….
First, why to be limited to just 1kHz numbers. If we want to consider the linearity, then not only mid-frequency linearity is important, but also low and high frequency linearity. The argument of inaudibility of high frequency distortion is pointless, as it creates intermodulation distortion products deep in the most audible part of the audio spectrum. Same stands for restricting of measuring bandwidth to 20kHz, yes we do not see the ultrasound products then, but again we know nothing about possible intermodulations in the audio band or in tweeters. The actual reason why the measuring range has been restricted in the past decade is a rapid entry of class D amplifiers to the market and corresponding business interests of the manufacturers, the parameters must look nice and there must be a continuous progress to justify new and new products.
Strictly technically speaking, the class D amplifiers still have not reached the parameters that are achievable with linear amplifiers. Now I am not talking solely about that 1kHz SINAD (or THD+N that has been used for decades to name the same parameter), but also about high frequency linearity, wide bandwidth with minimum phase shift in the audio band, fast rise time and clean output spectrum above audio band. The one and only advantage of class D amplifiers is reduced power consumption and thus smaller size, though the manufacturers and OEM assemblers then do not care much about proper thermal handling and it results in lower reliability of such products.
Back to that small class A amplifier. Class A (push-pull), in principle, keeps both + and – output halves always ON, supplied by current, so there is no switching distortion we may see in class AB, class B and class D. The biggest contributor to amplifier nonlinearity is excluded.
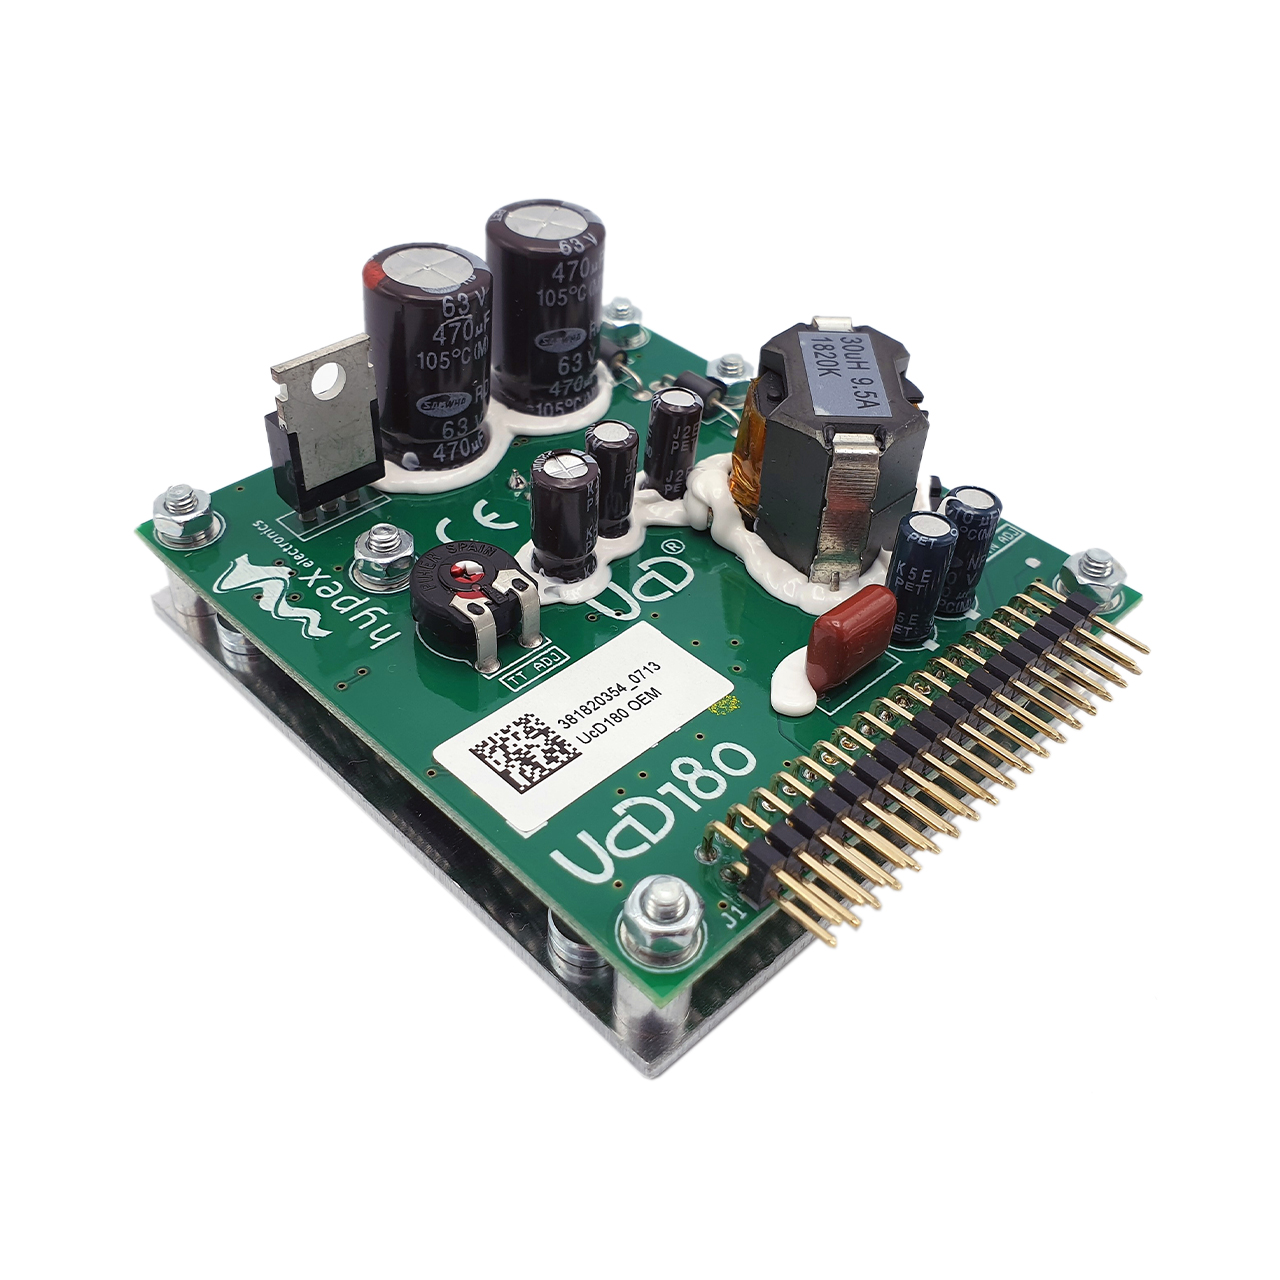
The PCB with the amp module looks like this
View attachment 201560
Oscilloscope measurements
Oscilloscope measurements are a key for every circuit designer and builder even in audio. Maybe not that much for the reviewers, as we can see. Understanding of oscilloscope measurements is important, as well as lab experience. These measurements tell us about amplifier stability and help us to identify possible issues inside the amplifier circuitry, which is impossible to be done by another measuring method. The king of oscilloscope measurements are square wave measurements, which tell us very quickly if the amplifier is stable, if it has flat frequency response and if it is flat at lowest and highest frequencies. From the square response (step response) rise time and fall time we read the -3dB high frequency cut off, from the pulse tilt at lower frequency we read the low frequency cut off. From the step response shape and overshoot we read the reserve in stability or tendency to oscillations. We can see all of this in 2 minutes if we are experienced operators.
Some oscilloscope measurements on the class A module
View attachment 201561
10kHz square response is used very often in audio reviews. The plot shows input signal (blue) and amplifier output (red). We can see that there is no overshoot and the response is smooth.
We can switch the time base to see rising edge in better resolution
View attachment 201562
Now we read rise time of the input square edge is 2.3us, of the output edge it is 2.64us. From these numbers we calculate amplifier rise time as 1.296us. From 1.296us rise time we calculate -3dB bandwidth as 270kHz. Easy.
Let's see the 100Hz square response
View attachment 201563
Almost no tilt of the output wave, so the low frequency extension goes well below 2Hz. We can read Gain = 28.08/1.26 = 22.29 (26.96dB)
And the 100Hz square response spectrum
View attachment 201565
Another way to see where the frequency response starts to fall at high frequencies. So we have a nice 2Hz – 200kHz amplifier, a good old standard to be 10x better than is the band of interest, to minimize time and phase errors. Where have all that requests gone.
So now to the frequency domain view
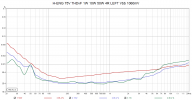
Let's see the THD vs. output power at frequencies from 1kHz to 15kHz, measured with 45kHz measuring bandwidth (REW). Sorry I would not show THD+N as well, because the “+N” component is in case of this amplifier totally defined by my measuring chain noise and this would confuse the issue and would not allow to see the distortion, which would be completely buried in noise at all levels.
View attachment 201566
Still, the distortion is rather a system distortion than amplifier distortion. Even in such case we can see 1kHz THD going below -120dB and 15kHz THD between -100dB and -110dB, show mw a class D amp which can do it when measured with @45kHz BW.
Any measurement of similar kind should be verified by another method, to exclude possible systematic error. So here is the measurement made with ARTA. ARTA is unable to calibrate X-axis in [W], so you will see voltage axis [V]. Both ARTA and REW results are closely similar.
View attachment 201567
Conclusion
Class D approaches to linear amplifiers in low and mid frequency linearity. We can still make linear amplifiers with much wider bandwidth, cleaner spectrum, shorter rise time and better step/square response than any class D amplifier. There is still what to investigate in class D and it should not be the 1kHz SINAD race only.

 www.hypex.nl