No, not a table...Did you mean how to create a table of the results?
I'ld like to know how a cable must be build to behave like this.
Standard transmission line model might need some frequency dependency of some components - just a guess...
No, not a table...Did you mean how to create a table of the results?
No, not a table...
I'ld like to know how a cable must be build to behave like this.
Standard transmission line model might need some frequency dependency of some components - just a guess...
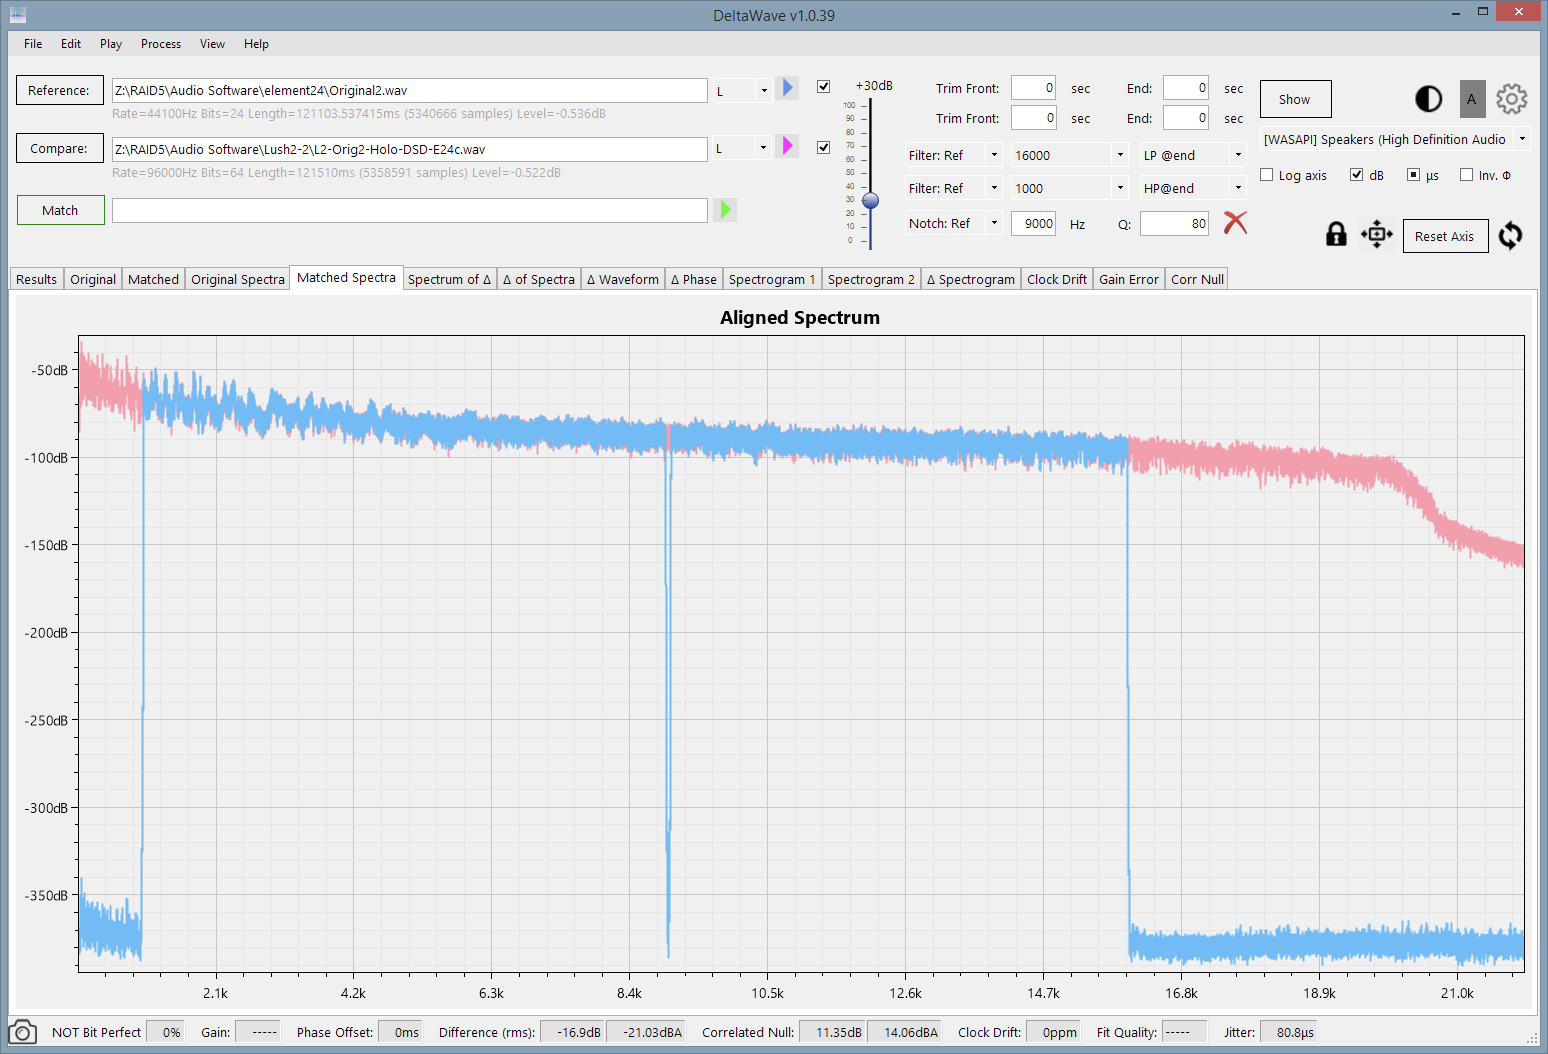
Question: is it possible to modify the range showing the level span in a Delta Spectrogram?
Why am I asking for that?
Did two loopback recordings:
Delta Spectrum tab doesn't show much.
- RTX6001 direct out-to-in
- RTX6001 SAM-1B (Funk) inserted
Exported Delta Wave gives more inside e.g. with Sonic Visualiser
View attachment 33385
")
Would like to see that - if only to just proofcheck my assumptionIt's the same difference as between Δ of Spectra and Spectrum of Δ tabs. I had it the other way around before, so I guess I could add it again
.Thank you.
My question aims at being able to adjust the width of the color scale (instead of from 5 to -2 dB e.g. from 2 to 1 dB).
This could make small differences visible - right?
Would like to see that - if only to just proofcheck my assumption
Is a version still available which does it the other way around? which one, in case it is?


Spectrogram range setting is great! Thanks.
May be it's just my pc: there is some error code displayed from time to time instead of an updated spectrogram (8GB Ram W7x64, FFT 16384, +5/-5)
On the 8GB win7x64 system 2.8GB are used before starting DW. OxyPlot exception occurs when DW uses about 2GB => total mem used 4.66GB (relates to 2.5GB free).If you are using 16384 size FFT for spectrogram, you are likely to run out of memory. ... It’s easy to use up gigabytes of memory this way without realizing it.
On the 8GB win7x64 system 2.8GB are used before starting DW. OxyPlot exception occurs when DW uses about 2GB => total mem used 4.66GB (relates to 2.5GB free).
Any chance to allow DW using more mem?

Somewhere between the last version I tried and 39, you have lost the ability to adjust the playback volume of the delta track in real time. The volume adjustment works if you stop playback, adjust and restart.
Stereo – nice
Are DSD files supposed to be working in stereo yet?
Looks like my win7 is a bit crappyNot sure why it would cause an exception ... But I'm using it on Windows 8:
 - time to finalize the move to win10.
Been following developments on this thread for a while now. Very nice work, @pkane.
I'm curious if you've had any time or even thoughts about Linux or Mac versions?
On a related note, I've been (v. slowly!) working a convolution engine for Linux and am doing some testing involving looking at deltas between input/output. I am using an FIR filter of 8 ktaps, all zeros except for a single unity value: just a unity pulse embedded in a filter of significant length to exercise the convolution engine internals.
If I do not attenuate the input file, I get a perfect null. As I increase the attenuation of the input, I find that I get a rms delta that increases as a function of attenuation, just doing: delta = input - (output/gain). Both input and output files are 16-bit, read and analyzed as 64-bit floats using Python tools. Internally, the engine works in 32-bit floating point.
Any thoughts on this, or alternative testing methods I could look at?
But it's running on a Windows VM. At some point I'll look at Wine or similar wrapper to make it work on different OSes.I'm using it on a Mac now
It sounds like something isn't right with the convolver or the FIR filter if different levels produce a different result.
Where is the unity value placed in the filter, and is the filter odd or even size (it should be symmetric)? Looking at the result on the plot would tell you much more about what might be going on, as there may be issues at the start/end of the input, or with individual hops. Spectrum plot would also be useful. Are you using OLAP? FFT Windowing?