• WANTED: Happy members who like to discuss audio and other topics related to our interest. Desire to learn and share knowledge of science required. There are many reviews of audio hardware and expert members to help answer your questions. Click here to have your audio equipment measured for free!

B&O Beolab 9 measurements

Marc v E

Major Contributor
Joined
Mar 9, 2021
Messages
1,132
Likes
1,657
Location
The Netherlands (Holland)
Hi all,

Long overdue but finally done! I managed to measure my speakers with Rew.

I measured using a umik1 microphone, in room, with the umik at my listening position. I don't use subwoofers or any eq.

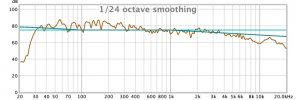
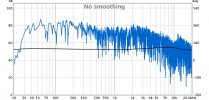
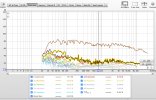
The first picture is the response with 1/24 smoothing applied; the second the raw result and the third the response plus harmonic distortion and noise. (The noise floor in the 3rd picture is highlighted in yellow because I clicked on it before taking the screenshot.)
IMG-20220812-WA0001.jpgIMG-20220812-WA0002.jpgIMG-20220812-WA0005.jpg
 
Last edited:
I am not surprised. Confirms my views on Bang Olufsen , customary but largely ignored excellence.

Exactly. Owning B&O meant no ticket to the audiophile's playground.
 
5% distortion in the bass at 80dB SPL is a bit on the high side. Most likely the distortion is lower.
I also hope the slope from 100Hz to 10kHz in reality is not 20dB but closer to say.....6dB or so.
That would make the sound very dark at the listening position which I am sure it isn't at all (Beolab 9 sounds 'full/neutral')
Room shows +/- 10dB variations in the lows (which is not unexpected).

Can you measure them at say 1m ?
 
Hi all,

Long overdue but finally done! I managed to measure my speakers with Rew.

I measured using a umik1 microphone, in room, with the umik at my listening position. I don't use subwoofers or any eq.

The first picture is the response with 1/24 smoothing applied; the second the raw result and the third the response plus harmonic distortion and noise. (The noise floor in the 3rd picture is highlighted in yellow because I clicked on it before taking the screenshot.)
View attachment 223826View attachment 223827View attachment 223828
Wow. Very impressive indeed.

How come you don’t even see any nulls caused by room modes below 200Hz? How can B&O cheat physics? Could you share a picture or describe your room and speaker positions? Or even the REW file?

Sorry lots of questions. Just very intrigued.

Thx
 
Last edited:
Wow. Very impressive indeed.

How come you don’t even see any nulls caused by room modes below 200Hz? How can B&O cheat physics? Could you share a picture or describe your room and speaker positions? Or even the REW file?

Sorry lots of questions. Just very intrigued.

Thx
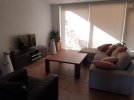
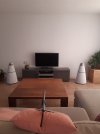
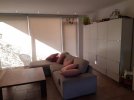
To be honest, I have no definate answer. I'll share some pictures. The speakers are 0.5 meter from the wall and 3 meters apart. I sit about 3.5 meters from where they stand. I placed the umik there to show the position of measurement.

The whole room is about 11 by 5,5 meters iirc.
(The pictures are somewhat darker because I closed the blinds against the sun. It's getting really hot.)

20220813_083634.jpg20220813_083704.jpg20220813_084208.jpg
 
Wow. Very impressive indeed.

How come you don’t even see any nulls caused by room modes below 200Hz? How can B&O cheat physics? Could you share a picture or describe your room and speaker positions? Or even the REW file?

Sorry lots of questions. Just very intrigued.

Thx
We do see room modes and SBIR, but the low resolution on the Y axes is partially hiding it. A 5 dB scale would have been a better way to show the measurements. For example like this:
CBT36 right speaker with subwoofer.jpg


That being said, the in room measurement here of the Beolab 9 is very good, though tuned a bit on the dark side. And not surprising either when you look at the speaker design. Of course; below approximately 100 Hz the placement and room mainly decides the result.
 
We do see room modes and SBIR, but the low resolution on the Y axes is partially hiding it. A 5 dB scale would have been a better way to show the measurements. For example like this:
View attachment 223909


That being said, the in room measurement here of the Beolab 9 is very good, though tuned a bit on the dark side. And not surprising either when you look at the speaker design. Of course; below approximately 100 Hz the placement and room mainly decides the result.
I tried to alter the scale to a higher resolution but couldn't find the controls to do so. I did manage to zoom in a bit to automatically create the 5db scale on the Y axis. Btw: I noticed the legend shows the % noise and harmonic distortion of the point I selected with the cursor. What should I select/deselect to get a good overview?

5DbScaleBeolab9.jpg
 
Using the zoom is changing the scale.

Are you measuring the speakers separately? If not, measure them one by one and show both channels.

I don't think there's any point of showing an unsmoothed measurement by the way. I would recommend using 1/24 oct. and something lower if you wish. A distortion meausurement in listening position isn't really valid and will also change with the SPL you're measuring with.
Ah right. Looks like I have to remeasure then. I used both speakers.
 
You could use also the SPL & Phase tab instead of the Distortion one to show and zoom just to the frequency response. With more than 20 dB drop it seems quite dark tuning, could you maybe also go to the IR Window button and select Frequency dependent window with the default 15 cycles to show more the direct sound of it too? Thank you. :)
 
The response is likely "dark" because the measurement of high frequencies are not valid since both channels have been measured together. It will change when he measures the speakers independently.

Personally I think the latest scale has too high resolution. I prefer looking at a graph with a resolution a tad lower unless it's nearfield measurement or the frequency response is exponential even. Easier for the eyes to see the whole picture. But that's just my opinion. :)
 
Usually when both measured together there are some interference dips in the highs due to not exactly mid placed mic, but the total trend doesn't change much, but we will see.

I also prefer 1/6-1/12 or var octave smoothing for such visulisations or even better MMM measurements which don't differ too much though with such smoothing unless the spatial averaging volume is very large. :)
 
You could use also the SPL & Phase tab instead of the Distortion one to show and zoom just to the frequency response. With more than 20 dB drop it seems quite dark tuning, could you maybe also go to the IR Window button and select Frequency dependent window with the default 15 cycles to show more the direct sound of it too? Thank you. :)
FrequencyResponseIRwindow15.jpg
 
Thank you, that confirms the quite dark tuning, except the dip around 6 kHz which is probably is a interfernce pattern result of measuring both with not 100% centered mic, maybe you could repeat that for each loudspeaker.
 
5% distortion in the bass at 80dB SPL is a bit on the high side. Most likely the distortion is lower.
I also hope the slope from 100Hz to 10kHz in reality is not 20dB but closer to say.....6dB or so.
That would make the sound very dark at the listening position which I am sure it isn't at all (Beolab 9 sounds 'full/neutral')
Room shows +/- 10dB variations in the lows (which is not unexpected).

Can you measure them at say 1m ?
Because I had everything already connected and cleaned up, I used the Topping Dx7Pro instead of the NAD C510 dac/pre.
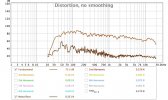
I measured 1 speaker with the umik1 from 1 meter distance.

I noticed something interesting: the distortion is almost exactly at 50Hz, the frequency of AC in my country.
Is this noise induced due to mains leakage into the signal chain?
 

Attachments

  • Beolab9_1meterNoiseFloor.jpg
    Beolab9_1meterNoiseFloor.jpg
    95.9 KB · Views: 196
Last edited:
Because I had everything already connected and cleaned up, I used the Topping Dx7Pro instead of the NAD C510 dac/pre.
I measured 1 speaker with the umik1 from 1 meter distance.

I noticed something interesting: the distortion is almost exactly at 50Hz, the frequency of AC in my country.
Is this noise induced due to mains leakage into the signal chain?

There is a good possibility it is mains noise. However, not in the playback system, but rather the recording system. Computers don't always have great power filtering, and the pre-amp section inside the microphone is very sensitive to mains leakage over USB.

Looking at your frequency response graphs, it is pretty good for an untreated room and no subwoofers. There are the natural peaks and dips in bass due to rooms, and the bass rolls off below 40Hz due to lack of subwoofer. Adding 1-2 good subwoofers would help that, and also improve your inter-modulation distortion, making the mid-bass region sound better as a result.

The miniDSP Flex is $600 with balanced IO, and would allow you to do subwoofer integration + room correction really easily by replacing the NAD C510.
 
Back
Top Bottom