• WANTED: Happy members who like to discuss audio and other topics related to our interest. Desire to learn and share knowledge of science required. There are many reviews of audio hardware and expert members to help answer your questions. Click here to have your audio equipment measured for free!

Alternative perspective on the Harman loudspeaker preference curve.

sigbergaudio

Major Contributor
Audio Company
Forum Donor
Joined
Aug 21, 2020
Messages
3,221
Likes
7,135
Location
Norway
Reference:
index.php


I think this graph is a bit misleading / easy to misunderstand. At a glance it looks like the untrained listeners want +12db in the bass, but that's not really the case. The flat area at 1-10khz for the untrained listeners is actually at +2/+3dB, so the total rise is closer to 9-10dB.

Similarly, the trained listeners appear to only want 4-5dB rise, but that's not the case either, as that graph continues down below 0dB.

So:

For untrained listeners, the difference between 50hz and 10khz is around 9-10dB
For trained listeners, the difference between 50hz and 10khz is 7-8dB


I've retraced them (roughly) here in two separate graphs normalizing them to the 1-2khz area instead, making it easier to see that they're actually not that different in total rise / how much bass each group wants. The big difference is that trained listeners prefers a more gradual / even roll-off, and more energy in a wider range of the upper bass / lower mid area. It is also worth noting/remembering that this was after all a relatively small study (11 participants alltogether).
1703083642145.png


1703083631769.png
 
Last edited:
It is also worth noting/remembering that this was after all a relatively small study (11 participants alltogether).
Absolutely. A total of 11 participants is hardly sufficient for a reliable statement.
So the trend/result may be correct or not so much. Are there follow up studies?
I overlayed your work to make it more easy to compare.
In the range 200-500 it seems to be a bit off, as the curves should be more or less parallel there.

1703075445994.png


EDIT: I updated the graph with the improved results from @sigbergaudio below.
1703085215083.png
 
Last edited:
Absolutely. A total of 11 participants is hardly sufficient for a reliable statement.
So the trend/result may be correct or not so much. Are there follow up studies?
I overlayed your work to make it more easy to compare.
In the range 200-500 it seems to be a bit off, as the curves should be more or less parallel there.

View attachment 335718

They're not parallel at 200-500, since I made them parallell at 1-2khz (which they are not in the original graph).
 
They're not parallel at 200-500, since I made them parallell at 1-2khz (which they are not in the original graph).
I've retraced them (roughly) here in two separate graphs normalizing them to the 1-2khz area instead,
Hm, to me it is not clear what you did.
"Normalizing to 2 kHz" to me would mean to shift the curves.
Even if you shift the curves to meet at 2 kHz they should keep their form and in the range 200-500 the curves are on top of each other.
So after shifting they should still be parallel.

"Making parallel" involves some way of rotation/adding a slope. Is that what you did?

1703076003170.png
 
Hm, to me it is not clear what you did.
"Normalizing to 2 kHz" to me would mean to shift the curves.
Even if you shift the curves to meet at 2 kHz they should keep their form and in the range 200-500 the curves are on top of each other.
So after shifting they should still be parallel.

"Making parallel" involves some way of rotation/adding a slope. Is that what you did?

View attachment 335720

I see your point now. Adjust the trained listeners slightly to better match the curve (updated first post as well)

@olieb can you update your overlay post as well perhaps. :)

index.php
 
Last edited:
Could you share these als txt/csv files so we can import them in REW and try/compare them to other target curves?

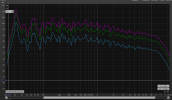
Haha, didn't even think about plotting it in REW, just traced it in excel. Here they are. Probably not perfect (hard to read from the Harman graph since the Y-axis isn't marked very well), but along these lines (graphs below and .txt files attached)

Trained listeners:
1703084047187.png


Untrained listeners:
1703084089077.png
 

Attachments

  • untrainedlisteners-rew-target.txt
    81 bytes · Views: 69
  • trainedlisteners-rew-target.txt
    85 bytes · Views: 79
Could you share these als txt/csv files so we can import them in REW and try/compare them to other target curves?
There's no such thing as target curve as long as I know.
There's house curve which is the natural result of a nice speaker into a decent room and it's a result,not target.
People forcing 'target' curves,specially over transition is wrong.
 
Haha, didn't even think about plotting it in REW, just traced it in excel. Here they are. Probably not perfect (hard to read from the Harman graph since the Y-axis isn't marked very well), but along these lines (graphs below and .txt files attached)
The curve I currently use is close to the trained listeners:

1703085724528.png
 
There's no such thing as target curve as long as I know.
There's house curve which is the natural result of a nice speaker into a decent room and it's a result,not target.
People forcing 'target' curves,specially over transition is wrong.

Yes, that's an important point, these are not target curves but simply the preference of a few listeners in a Harman study.
 
The curve I currently use is close to the trained listeners:

View attachment 335755

Good for you! :) What happens above 500-1khz or so depends on a combination of the speakers and the room (unless you force it of course, which you shouldn't).

That being said, here's mine! And no, I didn't add the target to REW until I uploaded it here, and the measurement is from January. :p
I hereby announce myself a member of the trained listeners group. :p :D

And oh, this is with zero EQ above 100hz. :)

1703086457886.png
 
Yes, that's an important point, these are not target curves but simply the preference of a few listeners in a Harman study.
Your preference should also be your target. ;)

Or if you are setting-up a pro recording studio, you should probably target the trained listener preference.
 
Good for you! :) What happens above 500-1khz or so depends on a combination of the speakers and the room (unless you force it of course, which you shouldn't).

That being said, here's mine! And no, I didn't add the target to REW until I uploaded it here, and the measurement is from January. :p
I hereby announce myself a member of the trained listeners group. :p :D

And oh, this is with zero EQ above 100hz. :)

View attachment 335757
That's mine (no EQ,no nothing).(more here ):

1703087036220.png
 
With frequency dependent windowing you can easily scale the amount of EQ going towards higher frequencies and for me it works better than stopping somewhere. If you call it target curve or house curve or whatever doesn't matter. I like to experiment with them and it's also fun to change it sometimes so you get the new hifi gear experience for free :D
 
For me I am leaning to get a decent disspersion and on axis neutral speaker, and only tune what is room dependent to the "Target", usually I am more on the trained listener curve
 
This is my favorite curve system too. However, I can not get my head around the trained-nontrained listener label. So everybody who wants more bass and treble is un-trained. Like somebody putting too much ketchup on his burger is „untrained“. So there is a trained elite who separates their listening pleasure from untrained guys. They were 11 - do we know their CVs? Did they call themself untrained or did the others label them as such after the test. Or were the untrained people - women? This is hilarious and says much about the whole Herman gang at that time.
 
So everybody who wants more bass and treble is un-trained.

A fire causes smoke, but smoke does not cause a fire.

So there is a trained elite who separates their listening pleasure from untrained guys.

Trained listeners are better at identifying what sounds correct. Untrained listeners tend to go more for the fun factor of extra bass and high end. Just like killing the natural taste of food with to much ketchup.
 
There are other studies on bass/treble preference though I can't recall if there's any specifically for speakers. Certainly some for headphones. And I seem to recall something on differences between headphones and speakers caused by lack of tactile sensation as well.
 
Reference:
index.php


I think this graph is a bit misleading / easy to misunderstand. At a glance it looks like the untrained listeners want +12db in the bass, but that's not really the case. The flat area at 1-10khz for the untrained listeners is actually at +2/+3dB, so the total rise is closer to 9-10dB.

Similarly, the trained listeners appear to only want 4-5dB rise, but that's not the case either, as that graph continues down below 0dB.

So:

For untrained listeners, the difference between 50hz and 10khz is around 9-10dB
For trained listeners, the difference between 50hz and 10khz is 7-8dB


I've retraced them (roughly) here in two separate graphs normalizing them to the 1-2khz area instead, making it easier to see that they're actually not that different in total rise / how much bass each group wants. The big difference is that trained listeners prefers a more gradual / even roll-off, and more energy in a wider range of the upper bass / lower mid area. It is also worth noting/remembering that this was after all a relatively small study (11 participants alltogether).
View attachment 335745

View attachment 335744
Maybe for the sake of clarity, especially to newcomers, also state that these are in-room responses (vs the underlying flat anechoic responses) and that the “bass hump” is the result (simply room gain) of the otherwise anecoicaly flat speaker.

As for the number of test subjects, afaik those 11 where the very initial test group. Other studies followed. One of which (by S Olive ) if I remember correctly, roughly quantified the proportion of listeners preferring more (ca 21%), less bass (ca 15%) bass by letting listeners adjust bass to their preference. It also showed that older listeners prefer less bass on average.

Again, as I am quoting from memory, I might be wrong and it is difficult to summarize all the studies as I have not seen such a summary. Overall I once read that several hundred had been conducted with various objectives and states of progression.

Maybe @Floyd Toole can chime in and give some hints or clarification?
 
Back
Top Bottom