ray_parkhurst
Member
- Joined
- May 18, 2023
- Messages
- 97
- Likes
- 101
The REF stylus purpose is twofold: ensure test record consistency; and give a reference vs the DUT. How do the DUT and REF responses compare at this point?

So far, no plots of Pluto 2 data have been published here yet, correct?It looks like we need to reset the process a bit. @BMRR had to give up the original Pluto preamp to get access to the Pluto2, and was not able to complete #2 and #4 from the original recording list. The Pluto2 looks to be giving a flatter response at LF, and eliminates the odd HF response, so we'll use it going forward, but we need to get a comparison between the DUT T24 and REF T0 to be sure we have consistent results and a valid reference. So here is the new list, all linked to in @BMRR's post above:
A. T0 on DUT with Pluto 1
B. T24 on DUT with Pluto 2
C. T0 on REF with Pluto 2
I am now most interested in comparing #B and #C to make sure the two styli are performing about the same, which would give us confidence in the measurement as well as the future usefulness of the REF to compare with the DUT as it wears. I don't think anyone expects any difference between T0 and T24 on the DUT, so as long as that holds true with DUT vs REF, we can continue with the experiment.
Can we get a comparison between #B and #C above?
I believe this plot was made from the recording of the experiment stylus and the Pluto 2:So far, no plots of Pluto 2 data have been published here yet, correct?
It was not explicitly identified in that post. All plots should clearly identify the DUT.I believe this plot was made from the recording of the experiment stylus and the Pluto 2:
It was not explicitly identified in that post. All plots should clearly identify the DUT.
Ah, my bad again, I didn't recall that experimental plots had "BMMR Test" identifying the DUT and it's signal chain in the plot itself, so not required in the author's textual portion. I'm still not sure if Pluto 2 had the 16K peak or not and if the newest proposal from ASR is implying that the test should start over completely with the Pluto 2 or some other equipment.It's not an 'official' plot as an experimental result - the labeling was very intentional.
Ah, my bad again, I didn't recall that experimental plots had "BMMR Test" identifying the DUT and it's signal chain in the plot itself, so not required in the author's textual portion. I'm still not sure if Pluto 2 had the 16K peak or not and if the newest proposal from ASR is implying that the test should start over completely with the Pluto 2 or some other equipment.
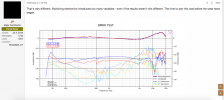
Thanks for the well reasoned summary. I agree that scientific test methodology should aggressively control variables and validate all equipment in the test setup to be certain that it is capable of measuring the information sought without introducing uncertainties of its own into the output data."Pluto 1" plots show a significant LF roll-off, slight mid range elevation, and as-expected HF with the 10.5kHz peak that is characteristic for the VM95 series. "Pluto 2" shows a much smaller LF roll-off, as-expected mid range, but a +6dB peak at 16kHz where with the loading as guesstimated (250pF) we should see a ~+1dB peak at 10.5kHz.
It appears something is rather significantly off, and that should absolutely be identified. I think the advice is as it always was - verify the electronics and measurement data before beginning an experiment, multiple laybacks to identify and average-out errors like the ~3dB left channel drop in the HF of the first plot, etc.
I'll not be spending anymore time on this as-is.
What an interesting topic, just found this, subscribing. Hopefully you'll have the new tests running again soon! Thank you for your efforts, it is amazing something like this has not really been made earlier.
Something like that. It is why I gave up on trying to take vinyl records seriously. Incidentally, does anyone know if those spectrogram programs on computers show the same amount of distortion (about 10%, or the spectrogram 1920x1080 of a FLAC file is less than 1% distortion)?On15k most cartridge har 10+% distortion….3% is not a realistic number old or new
Something like that. It is why I gave up on trying to take vinyl records seriously. Incidentally, does anyone know if those spectrogram programs on computers show the same amount of distortion (about 10%, or the spectrogram 1920x1080 of a FLAC file is less than 1% distortion)?
What about those MC pickups the frequency response is specified to 45 or 50 kHz, usable for CD4? They cannot have such a low resonance.Most cartridges today have relatively (!) heavy aluminium tube or solid rod exotic cantilevers - their cantilever/tip resonance is often around the 15kHz mark - and that resonance will increase mistracking, resulting in increased distortion. (all theoretical...).
Actually those exotic tube cantilevers and the line contact needles were all designed to better pick up the carrier frequencies of CD4.What about those MC pickups the frequency response is specified to 45 or 50 kHz, usable for CD4? They cannot have such a low resonance.
Certainly. But they also track better in the audible range, I think.Actually those exotic tube cantilevers and the line contact needles were all designed to better pick up the carrier frequencies of CD4.
Even in the hidays of CD4 those quadrophonic records probably were good for much less number of plays than stereo recordings.With regards to effectiveness of CD4 tracking - well how many people today bother trying it? How many actually test that frequency response? - There are very few test records with tracks extending up to or past 50kHz... and I doubt most vinyl presses today would be capable of producing records with frequencies going that high (reliably).
Did you measure one of the AT MC pickups like the AT33PTG/II (the one I bought this year) or the AT-OC9XML, by change? Or one of the Van den Hul pickups (those are all specified to 50 kHz and higher)?I've measured those resonances on V15V's, AT440, AT152 and a bunch of other cartridges.... courtesy of a spreadsheet which models the electrical parts of the response, deducts that from the measure F/R and provides me with the "raw" F/R - where the resonance is usually obviously exposed (I'll need to dig up some of those measurements I made 10 to 12 years ago and post some examples...)
YepCertainly. But they also track better in the audible range, I think.
YepEven in the hidays of CD4 those quadrophonic records probably were good for much less number of plays than stereo recordings.
No, I don't own an AT MC... I have measured a Sony MC, and I also have a close relative of the VanDenHul - which is an Empire MC1 (late 80's) - it is however one of the more basic models, without an exotic cantilever, and with only an elliptical tip. At the time Emprie and VdH partnered up and did a series of MC's which were effectively re-badged VdH MC's, the current "Frog", MC10, and MC1, all still use the same housing as my own 40 year old Empire MC1, I have no idea whether the innards are also the same or have changed over the decades.Did you measure one of the AT MC pickups like the AT33PTG/II (the one I bought this year) or the AT-OC9XML, by change? Or one of the Van den Hul pickups (those are all specified to 50 kHz and higher)?
On second thought, that resolution shows about 0.1% distortion (if one compares the same vinyl record from another playback of course).Incidentally, does anyone know if those spectrogram programs on computers show the same amount of distortion (about 10%, or the spectrogram 1920x1080 of a FLAC file is less than 1% distortion)?

 thelastfactory.com
thelastfactory.com
thelastfactory.com