• WANTED: Happy members who like to discuss audio and other topics related to our interest. Desire to learn and share knowledge of science required. There are many reviews of audio hardware and expert members to help answer your questions. Click here to have your audio equipment measured for free!

Is it possible to automatically correct the phase using REW arithmetics?

AudioBoy

Member
Joined
Jan 23, 2023
Messages
66
Likes
34
Hello guys!

I was wondering is it possible to correct the phase using REW mathematics? What prevent us to use this app potential to get rid of excessive phase elements in our measurements and get nearly perfect FIR filter which then could be used in Roon or Equalizer APO?

Of course there is great app by the name of rePhase and bla-bla-bla... But its developer no longer interested in add more features in it as I think.
Also fixing the phase manually its kind a hard if you has a very complex phase shape graph or don't know your XO frequencies.

I think I got some sort of acceptable results but could not export usable FIR filter. Maybe you could provide some help so I can finish it.

Let's take some measurements of accoustics in some abstract living room.

01.png


Then make some equalization of frequency response or completely ignore this step if you don't need it. But if you do you'll get a set of eq filters to work with later.

02.png


The step response looks like this and far from perfect.

03.png


Next let's create minimum phase version and excess phase version of our equalized FR graph using REW.
The step response of minimum phase version graph and phase itself looks great!
I want it too :)

04.png


If I understand documentation correctly our measured phase of frequency response consists of minimum phase + excess phase. So if we could get rig of excess phase from our measured phase we can get a minimum phase version. Then we could build a FIR filter which corrects frequency response and phase altogher.

04-1.png


To do this we need to invert excess phase to create first multiplier for futher work. Let's generate it.

05.png


I called the result as Inverted Excess.

Then multiply equalized frequency response measurement (L EQed in my case) to inverted excess graph.
As result we got equalized FR graph without excess phase that is minimum phase version of it.

06.png


Phase now looks great (for minimum phase :) )!

07.png


But step response (and impulse response) got some pre-ring junk (rounding errors I guess) and its no good.

08.png


To get rid of them frist we need to extract those errors and then exclude them from our graph (Shaggy EQed MP as I called it).

09.png


The errors graphs (let's call it Junk) should look something like this

10.png


OK. now we can exclude errors from our Inverted Excess Filter and create Min Phase Filter

11.png


Test it by multipling L EQed graph to Min Phase Filter.

12.png


Everything looks wow! I believe you could never achieve similar results using rePhrase.
Believe me I tried a lot :)

But here comes the hardest part - how to export created FIR filter without losing it precision?

First of all, it's huge!
But I guess there are a lot of junk information which could be trimmed.

14.png


Second,

when multiplied by an EQ filter, it can introduce errors into the final filter, resulting in strange pre-ringing. This is noticeable in the step response graphs (maybe I could excluded it the same way as I did previously). Although if you multiply everything one by one, then everything looks good, as in the pictures I provided. When listening using such a filter, some kind of high-frequency whistle or sound appears in the music, although everything else seems to be in order.

In general, I'm stuck here and would be glad for any ideas and help.
Thanks in advance.
 

ernestcarl

Major Contributor
Joined
Sep 4, 2019
Messages
3,113
Likes
2,330
Location
Canada
To get rid of them frist we need to extract those errors and then exclude them from our graph (Shaggy EQed MP as I called it).

How or why did you end up with these "errors" in the first place?

Did you not try applying some amount of windowing prior to excess phase extraction?
 

ernestcarl

Major Contributor
Joined
Sep 4, 2019
Messages
3,113
Likes
2,330
Location
Canada
The step response looks like this and far from perfect.

Seriously, that doesn't look too far from perfect to me. However, how did you obtain your measurement? Initial noise or deviation shouldn't be there.
 
OP
AudioBoy

AudioBoy

Member
Joined
Jan 23, 2023
Messages
66
Likes
34
Hi, ernestcarl. Thanks for your attention to my post :)

How or why did you end up with these "errors" in the first place?
I guess these "errors" are some kind of rounding errors or an excess phase data "noise" created by REW from my equalized measurement.
When I'm creating excess phase graph it's already big

01.png


and look like this

01.png

Did you not try applying some amount of windowing prior to excess phase extraction?

yes and it helped to avoid "noise" at step response and I don't need to remove it by hands anymore, but it did not help to create final FIR (Equalization Filter x Phase Fix).
Final step response has heavy pre-ringing (but other things look more or less as normal)


02.png


the most funny thing is when I'm using Inverted Excess (windowed) Filter with already equalized graph the resulted step response looks almost perfect

02.png


But when I'm using combined filter (Equalized FR Filter x Phase Fix Filter) with original non equalized measurement it gives me pre-ringing like at the picture above.
How could it be possible? :confused:

Maybe I did something wrong when creating Equalized FR Filter, but It works when I'm multipling them separately... IDK

However, how did you obtain your measurement?

I'm using RME Babyface Pro with XLR Neumann MA-1 measurement mic + calibration file.

This is my mdat file if you need a closer look.
 

palm

Member
Joined
Mar 4, 2023
Messages
74
Likes
62
Here’s my take at it: pre ringing with high frequency content like the small ripples visible on your step response will indeed be audible, at lower frequencies it Is less problematic. Correcting for excess phase requires a non-causal filter that can be implemented as FIR with a delayed main impulse (and therefore latency that is not compatible with all use cases). If things were perfect this time reversed part of the filter would act like an anti echo and the step response after correction would be perfect without artifacts.
Intuitively, preringing with HF content will be limited by frequency dependent windowing / variable smoothing, while the large LF ripple at t<0 we see on one of your step response is the consequence of trying to fix group delay down to very low frequencies like the bass reflex characteristic of a subwoofer.
 

ernestcarl

Major Contributor
Joined
Sep 4, 2019
Messages
3,113
Likes
2,330
Location
Canada
See if this is satisfactory:


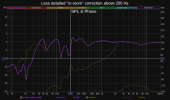
Above the bass or transition region, correction should be *LESS detailed for magnitude & phase EQ while windowing should be *MORE generous -- esp. with not enough data (e.g. single-point in-room measurements at the MLP).

I used 4-5 frequency dependent windowing (FDW) prior excess phase extraction. I try to view and avoid "fixing" extremely narrow phase skews/GD peaks.

Don't sweat "accuracy" and "precision" in the HF. Most of the time, you should only be applying very broad strokes of correction/compensation.

I set 683ms (approx. FIR centering delay) to the left width/window of the inverse filters prior exporting the windowed IR filter (64k sample count, 48k sample rate) to a wave file IR.


Before and After FIR EQ correction or compensation:

1695282670503.png 1695282686036.png 1695282699553.png 1695282702678.png 1695282705248.png 1695282707663.png
 

Attachments

  • LR-683ms_FIR_FILTERS.zip
    466.3 KB · Views: 52
Last edited:

gnarly

Major Contributor
Joined
Jun 15, 2021
Messages
1,035
Likes
1,471
My 2c,

As I think you follow, impulse inversion (1/A) is the basic root of FIR correction.
Knowing that, it just comes down to what do we want to correct, huh?

First, a disclaimer....I only have confidence discussing FIR corrections at the driver level.
Making corrections at the speaker level, is above my pay grade still....or maybe I do understand it, and don't think it's the way to fly. Dunno.

At the driver level, I can pretty much assume the driver behaves as minimum phase, and separating "excess phase" to derive minimum phase, is no more than removing constant fixed delay from the measurement. And I think it gets a bit silly, overly complicated, to even think about "excess phase".

Impulse inversion simply works at the driver level....get rid of constant delay (measurement time-of-flight, processing delay, etc.) and the idea of "excess phase" disappears.
Then it just comes down to min phase work, where fixing frequency magnitude also fixes phase.

Ok, yep, I think REW can do a great job at making FIR files via (1/A)....but again at the driver level.....
To test my ability to use REW's trace arithmetic for this, i put a coaxial compression driver on a horn, and measured it in a clothes closet to squelch "room reflections"

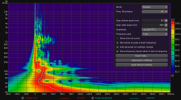
Here's a slide of the CD's HF section raw measurement, the 1/A inverse of it multiplied by a crosser, and their convolution.

HF waterfall set.jpg


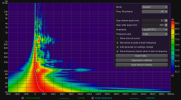
Here's the VHF section.
vhf inv with xover.jpg


Both of those sections final outputs were impulse inversions multiplied by crossovers. I had an obviously too hi xover freq for the VHF section.
But even that didn't matter when it came to end results of summation of the processed HF and VHF sections.
HF and VHF processed waterfall set.jpg


Ok again, all that was really meant just to gain some credibility with what was was done with REW. And that i might have a clue, or maybe not!
Imo, those waterfalls are near perfect. Step and impulse would be too, I just didn't save them.
IMSO, freq mag and phase are all we care about anyway, as all ancillary plots are derived from those.

So fwiw, a couple of thoughts....

I don't think we ever need more than say 700ms of FIR time for corrections, period. And that is for delving down into very low freq work.

HF needs very little FIR time. FIR time needed for corrections halves for every octave increase...like everything in audio, logarithmic.

The minute junk on your plots before impulse start, imo is just noise... not worth any attention, certainly not correction. It's not pre-ring ime.
I'd say by all means let go of any desire to flat line the small junk prior to impulse start.

The larger dips/oscillations prior to impulse are where to pay attention ime....

Anyway, hope this helps...
 

ernestcarl

Major Contributor
Joined
Sep 4, 2019
Messages
3,113
Likes
2,330
Location
Canada
First, a disclaimer....I only have confidence discussing FIR corrections at the driver level.
Making corrections at the speaker level, is above my pay grade still....or maybe I do understand it, and don't think it's the way to fly. Dunno.

Think of it as something extra that might improve things further.

Most people unfortunately are not in a position to do individual DIY driver DSP adjustments.

And, even if they bought themselves and are setting up anechoically flat speakers, that does not guarantee the highest performance and satisfaction when it’s thrown in some random room. Some amount of extra EQ tinkering afterwards is almost always going to be relevant regardless of a “perfect” driver and speaker design. Genelec has GLM and Neumann has the MA-1 — most users seem to think their accompanying “room correction” software is essential despite the already excellently performing speakers.
 

palm

Member
Joined
Mar 4, 2023
Messages
74
Likes
62
Thanks @ernestcarl for sharing the mdat file. I’m trying to understand your process. I’m not new to REW and FIR correction but I made a long pause and trace arithmetics are new. And sometimes I’m not sure which of the windowing or smoothing are just for visualization or really have an impact on the next operation.

Using the EQ trace export I created synthetic impulses (you need to generate minimum phase version apparently to get some temporal information) delaying and adding to simulate reflections.

There is a nice tutorial video in which complete signal is used but then after correction filter is calculated a minimum phase version is derived and used. (and phase correction can be done separately in rePhase)

DRC FIR on the other hand seem to perform right at the start the decomposition into minimum and excess phase and different windows are used.

In your mdat file it looks like you are also making a round trip to rePhase?
But should we understand that you corrected separately the magnitude and excess phase?
 

ernestcarl

Major Contributor
Joined
Sep 4, 2019
Messages
3,113
Likes
2,330
Location
Canada
Using the EQ trace export I created synthetic impulses (you need to generate minimum phase version apparently to get some temporal information) delaying and adding to simulate reflections.

...
In your mdat file it looks like you are also making a round trip to rePhase?

Hmmmn... I don't recall any need to use the minimum phase version in this scenario (yes, occasionally I've found a use for it, but not here).

AudioBoy suggested to use only REW so I didn't use rePhase. Though, personally, I do use both rePhase and REW.


There is a nice tutorial video in which complete signal is used but then after correction filter is calculated a minimum phase version is derived and used. (and phase correction can be done separately in rePhase)

Eh, not sure which video you refer to... is it one by @OCA?


But should we understand that you corrected separately the magnitude and excess phase?

Yes.

There are ways to perform magnitude and phase correction by combining trace arithmetic operations with regularisation plus range limiting to fit a target...

However, in this particular case, I used REW's EQ window to create auto-generated as well as manually entered filters.

1695435341196.png


1695435293254.png 1695435300116.png 1695435303349.png

1695437840428.png


In general, when devising filters below the room transition, less or no smoothing can be used; however, as one goes higher up in frequency more smoothing and/or windowing should be used. But it also really depends on how the measurement for correction was obtained e.g. quasi-anechoic or nearfield vs farfield, single-point vs spatially averaged, not to mention taking into account other room acoustics and speaker directivity considerations.


I’m not sure which of the windowing or smoothing are just for visualization or really have an impact on the next operation.

The previously mentioned 4-5 FDW was specifically applied to the min phase/IIR fully equalized response (EQ LNoMe Slow) prior excess phase version extraction just so that REW ignores the unwanted noise (as shown below) in its calculations. Now, we could, of course, ignore it and eye-ball an all-pass phase inversion ourselves if performed manually via rePhase, too.

1695435458072.png 1695435461034.png

The excess phase inverse can be convolved with either the uncorrected and without FDW measurement (LNoMe Slow) or directly with the REW generated EQ filters curve.


DRC FIR on the other hand seem to perform right at the start the decomposition into minimum and excess phase and different windows are used.


I have read through the DRC FIR documentation more than once (actually, several times) as a general reference, and while incredibly configurable, it is also very long, complicated and deeply involved... with many, many programmable algorithmic operations or steps including over a hundred parameter settings -- I mean, while you might want to understand its process and some of the details -- uh, seriously, though, a lot of what DRC FIR does in the background may be skipped, simplified or ignored for what we're trying to accomplish at the moment -- which is just quite a basic/simple inverse magnitude and phase FIR correction filter.
 
Last edited:
OP
AudioBoy

AudioBoy

Member
Joined
Jan 23, 2023
Messages
66
Likes
34
And sometimes I’m not sure which of the windowing or smoothing are just for visualization or really have an impact on the next operation.
I usually select a window based on the interval of the first reflection, which can be calculated from the impulse response graph.

1695452898193.png


The graph shows that we have approximately 4.3 milliseconds of relatively clean signal before the first reflection is detected.
The situation is aggravated if the speakers are located in a corner or the room is small. The first reflections arrive almost instantly and we have practically no clean signal.

There is a nice tutorial video in which complete signal is used but then after correction filter is calculated a minimum phase version is derived and used.
Could you provide a link to it, please ?

Eh, not sure which video you refer to... is it one by @OCA?
thought the same :)

Here is my another try with FDW of 7 (IIRC) and inverse equalization. Still ringing, but noticable only on separated drum parts.
 
Last edited:

palm

Member
Joined
Mar 4, 2023
Messages
74
Likes
62
I usually select a window based on the interval of the first reflection, which can be calculated from the impulse response graph.

Could you provide a link to it, please ?

I was probably not clear. There are operations such as trace arithmetics, that will provide the same output regardless of some options, while other options will impact the output. From playing around it seems that smoothing is only impacting the current view and not the calculation, while the windowing will impact both the graphical view and the result. And I think it’s a good choice but like any tool it takes a lot of practice to have perfect control so that the outcome of any action is not a surprise.

Yes, I mean this video ;)

edit: so it’s actually very clear in the documentation:
  • The currently applied impulse response window settings are used for each trace (…) Any frequency-dependent settings are excluded, applying an FDW to the result would amount to applying the window twice, as it is already applied to the data used to produce the result.
  • The result of arithmetic on measurements that have compatible impulse responses is smoothed using the measurement A smoothing, unsmoothed data is used during the calculations (…)
 
Last edited:
OP
AudioBoy

AudioBoy

Member
Joined
Jan 23, 2023
Messages
66
Likes
34
Check out rephase and tutorials: https://rephase.org/

rePhase is great when you need to fix it once or twice. But when you try to determine the best speaker placement or test multiple speakers in a row, you won't like it. Moreover it very annoying constant jumping from one software to another just to check if it enough phase equalization you've made or you already overdo. there is even no possibility to set minimum phase template in background so you could know how close you to it.

Don't get me wrong I like rePhase, but it doesn't develop anymore, though there are many feature that people would like to see in it.
 

palm

Member
Joined
Mar 4, 2023
Messages
74
Likes
62
Hmmmn... I don't recall any need to use the minimum phase version in this scenario (yes, occasionally I've found a use for it, but not here).
In the EQ window, you can export a trace as measurement, but there is no associated impulse for this FR. You can generate one however by clicking on the minimum phase button. Indeed, it is not needed during the trace arithmetics dance for filter generation with the inversion method. But if you want to add delayed impulses to simulate reflections as a synthetic example then you need to.
 

OCA

Addicted to Fun and Learning
Forum Donor
Joined
Feb 2, 2020
Messages
679
Likes
499
Location
Germany
In REW, one can extract excess phase, invert it in time and smooth it as needed. Besides, it has 2nd degree allpass filters which can also be time reversed with trace arithmetic operations and they could take care of speaker crossover and box phase shift corrections. However, the procedure will not be as straight forward as in rePhase.

I would say, the only major disadvantage of REW compared to rePhase is the lack of window and centering optimization tools for filters with minimal tap counts.
 
Last edited:

palm

Member
Joined
Mar 4, 2023
Messages
74
Likes
62
However, in this particular case, I used REW's EQ window to create auto-generated as well as manually entered filters.
The previously mentioned 4-5 FDW was specifically applied to the min phase/IIR fully equalized response (EQ LNoMe Slow) prior excess phase version extraction just so that REW ignores the unwanted noise (as shown below) in its calculations. Now, we could, of course, ignore it and eye-ball an all-pass phase inversion ourselves if performed manually via rePhase, too.

The excess phase inverse can be convolved with either the uncorrected and without FDW measurement (LNoMe Slow) or directly with the REW generated EQ filters curve.

This is perfectly clear now, thanks !

I have read through the DRC FIR documentation more than once (actually, several times) as a general reference, and while incredibly configurable, it is also very long, complicated and deeply involved... with many, many programmable algorithmic operations or steps including over a hundred parameter settings -- I mean, while you might want to understand its process and some of the details -- uh, seriously, though, a lot of what DRC FIR does in the background may be skipped, simplified or ignored for what we're trying to accomplish at the moment -- which is just quite a basic/simple inverse magnitude and phase FIR correction filter.

I started my journey with DRC FIR in 2006 or so, and yes it is complicated but FDW parametrization with an exponent, separately for magnitude and phase correction is still a great idea today, we “just” lack an interactive GUI showing these choices (abacus with equivalent reference psychoacoustic audibility limits) and the resulting curves. I was less convinced by the automatic target curve based on the enveloppe.

After this I also used REW EQ and the generic impulse as a filter, used Audyssey in my HC setup, bought IK ARC to use MultEQ on the stereo setup in combination with rePhase but just as a theoretical correction of the crossovers.

Today I use an RME ADI-2 and only 4 gentle “mono” PEQs. My old interface isn’t supported anymore (EMU 0404) so I can’t use my measurement mic and I used HouseCurve on iOS to roughly measure my system :)
But I read the posts here and of course I can’t help digging into this FIR based correction again !
 

ernestcarl

Major Contributor
Joined
Sep 4, 2019
Messages
3,113
Likes
2,330
Location
Canada
I usually select a window based on the interval of the first reflection, which can be calculated from the impulse response graph.

View attachment 314034

The graph shows that we have approximately 4.3 milliseconds of relatively clean signal before the first reflection is detected.
The situation is aggravated if the speakers are located in a corner or the room is small. The first reflections arrive almost instantly and we have practically no clean signal.


Could you provide a link to it, please ?


thought the same :)

Here is my another try with FDW of 7 (IIRC) and inverse equalization. Still ringing, but noticable only on separated drum parts.

There are some caveats with letting REW do the inverse calculations:

1695477757192.png 1695477768933.png

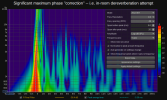
That "pre-energy" smearing in the first filter I created is likely harmless -- just some HF artifact from the generous FDW applied in REW -- which is another reason why I prefer to use manual phase EQ in rePhase.

Honestly, the filter you have created afterwards does not seem to me like 7 cycles of FDW were applied. Are you sure you want that level of EQ "correction" detail?

1695479350826.png 1695489831738.png

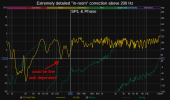
Besides the very detailed magnitude FR compensation (correcting extremely variable/position dependent comb filtering), it is also trying to cancel out speaker+baffle+stand and room delayed reflections all from single-point measurement. This is generally not recommended.

There are indeed cases where such filtering may be useful such as in some horn driver waveguide geometries with large phase plugs:

1695479057353.png


and

1695479236268.png


3.1 Compression Driver Phase Plugs

A first subsystem, which is particularly well suited to digital preconditioning, is the time smear produced by compression driver phase plugs.

The openings in a phase plug are arranged in such a way that, from any point on the diaphragm, the path to an opening is relatively short. The designer of the compression driver intends for all of the sound power produced within the driver to leave via the “nearest exit”. However, a significant fraction of the sound energy arriving at a phase plug opening will either continue past it or reflect back from it; in either case arriving later at other phase plug slots where the sound is divided again, ad infinitum. Rather than a single acoustical impulse, the response exhibits a decaying sequence of impulses...

3.2 Horn Resonance

A second loudspeaker behavior, which yields well to digital preconditioning, is horn resonance. A wavefront progressing down any horn will encounter one or more discontinuities in the area expansion. All horns present a discontinuity at their mouths. Constant directivity horns often employ a diffraction slot to achieve a wide coverage pattern at high frequencies. The exit of this slot represents a severe discontinuity.

A discontinuity in a horn’s expansion produces a reflection. A fraction of the sound power reverses course and returns to the compression driver where it is partially absorbed and partially re-emitted, often several milliseconds late. This process is, of course, regenerative, once again producing a decaying series of arrivals. Low frequencies tend to reflect more strongly than high frequencies, so the reflections are most prevalent in the lowest octaves of the horn’s usable range. It is this precise phenomenon that produces an audible artifact commonly described as a “honk”.

The wavefront does not return to the compression driver in a perfectly coherent fashion, but it appears that the bulk of the reflected energy does converge back at the driver. To the extent that it does, the phenomenon acts as a two-port system, and is correctable via signal preconditioning. The spectrogram in figure 3.2.1 displays the transient response of a typical high frequency horn. In particular, note the relatively slow decay between 500 Hz and 7 kHz. This characteristic can be greatly reduced with a signal preconditioning filter. The same system with a preconditioning filter applied is shown in figure 3.2.2.. The improvement in the transient decay is very apparent in the data, and listening tests have verified that the specified filter greatly reduces the colorations listeners describe as “honk”.

However, these are created from averaged anechoic measurements.
 
Last edited:
Top Bottom