
I continue to hear differences between amplifiers that might be expected to be inaudibly different. That is, for two high-SINAD systems that I'm not running into clipping, I hear differences. I also believe in measurements. My perspective has been consistent: "Everything that can be measured may not be audible. Everything that is audible is measurable -- but you need to select the right measurement."
I think I'm a pretty open-minded audiophile. I've sold off higher-end, more prestigious speakers after discovering that a Bose 901 Series VI worked fortuitously well in my room. I've returned, with restocking fees and shipping expenses, new gear that I should have been biased to like from the novelty alone. Sometimes, I get to recover my losses by selling off an expensive product that is bested or matched by a lower priced product.
How does the $90 Fosi Audio V3 compare to the $9,000 Marantz PM-10 integrated amplifier?
Scenario:
I was lent a Fosi Audio V3 integrated amp with a 48V power supply with the request to run some measurements on it to make it was performing to spec. There wasn't any issue with it -- the owner knew that I have amplifier test gear and was curious. My 5W SINAD is 86.9 dB which is good enough to match @amirm 's measurements. I did my tests with an E1DA Cosmos ADC (Grade A) and Vishay-Dale 1% non-inductive resistors. I used my Marantz SA-10 as a signal generator, so the test instrumentation is nowhere as good as the APx555. I also didn't spend a lot of time with grounding. The measurements show that it's a good sample.
The Fosi Audio V3 on test

You can actually keep pushing this harder and harder and the SINAD keeps getting better.
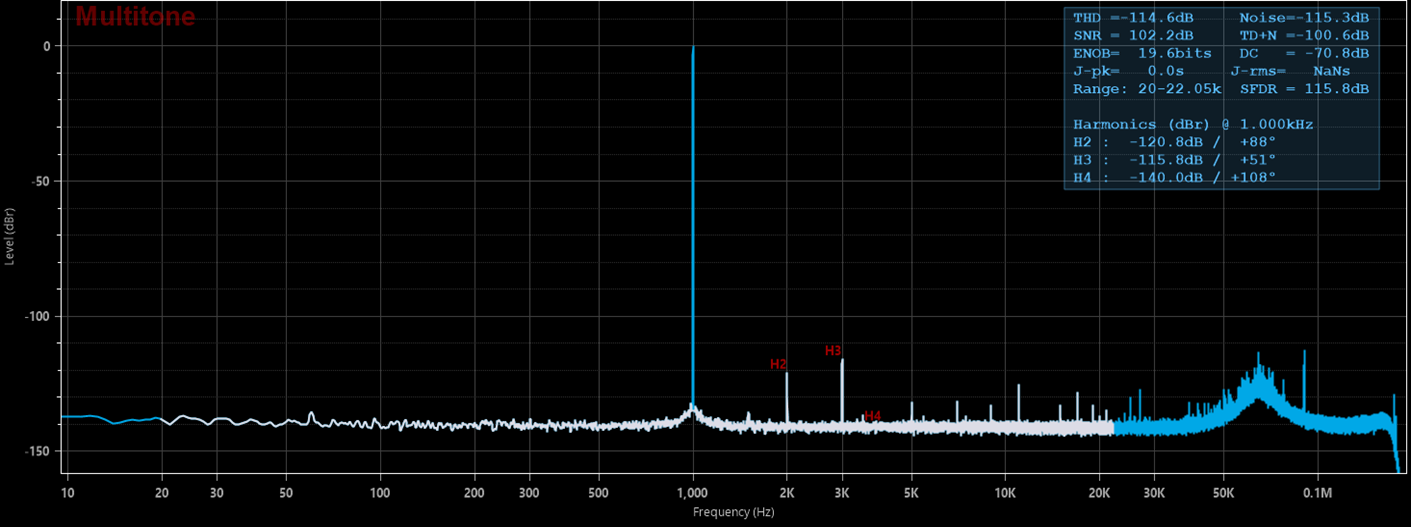
The Marantz PM-10 has a SINAD that breaks the 100 dB barrier. This was done with a 20-22.05 kHz range instead of 20-20kHz, so it's probably in the 101 dB range.
Setting up my Subjective Tests
My reference integrated amplifier is the Marantz PM-10 which is built around a bridged HypeX NC500OEMs/SMPS600 design (so 4 NC500's + 2 SMPS600) along with Marantz's own pre-amp and buffer. My go-to passive bookshelf is the JBL XPL90 which has the benefit of being tested on the NFS here.
First step was volume matching. This was done with a MinDSP UMIK-2 placed at the main listening position.
Calibrating Volume
I used REW to calibrate levels. Per my conversations with @JohnPM , REW will send out pink noise from 500 Hz to 2000 Hz (a "speaker calibration") signal based upon my standardized sweep. The Marantz SA-10 outputs a fixed voltage and the Marantz PM-10 has 0.5 dB volume precision while the Fosi V3 has an analog logarithmic potentiometer.
With a -10 dBFS test signal in REW, I adjusted the volume reported by "Check Levels" to show 80 dB at the listening position with the speaker calibration pink noise. I then ran two sweeps above and below that level: +0 dBFS and -20 dBFS.

Volume matching is better than the 0.5 dB you can achieve with the Marantz's volume control. I have pretty good dexterity, and I am at the limit of what can be done by adjusting the Fosi V3 knob. You can see that the Fosi in green/red is slightly louder in the treble relative to the Marantz. This is just 1 dB of difference or less.
Once I had this level of volume matching, I did my listening tests by unplugging the Fosi V3 so that I wouldn't have to touch the volume dial.
Subjective Impressions
I started with the Fosi V3 and listened to Hotel California. My first impression was "wow. I didn't remember my XPL 90 having this kind of bass." When the vocals came in, I was disappointed and it sounded recessed or less natural. My initial thought was that I was just noticing the limitation of the speaker. I swapped to the Marantz PM-10. As soon as the track started, I felt as if the guitars were more natural. But the bass didn't impress. It wasn't anemic - it just didn't surprise and delight. When the voices came in, it sounded wonderful -- the sort of giddiness or smile that you probably got when you heard this track on your first premium system. The soundstage and vocals were noticeably better on the PM-10, but no one could reasonably say that it was 100X better. For me, it was the difference between "a wow and a smile" and "I can't complain".
Measurements
After my subjective impressions, I decided to try something new. I moved my UMIK-2 back to the listening position and recorded the first 3 minutes of Hotel California on each system. A 48 kHz sampling rate was used. I then brought the recordings into @pkane 's DeltaWave for analysis.
DeltaWave shows that my volume matching was as good as it gets. 0.05 dB difference in RMS. Deltawave corrects this to 0.007 dB.
Initial RMS values Reference: -29.814dB Comparison: -29.761dB
If we look at the aligned spectra, which is the comparison *after* DeltaWave has done its level/phase adjustments, the white (FOSI V3) does have more content below 30 Hz than the blue (Marantz PM-10).

The JBL XPL90 is a bookshelf speaker, so it cannot reproduce anything this low with meaningful SPLs. It's -30 dB at 20 Hz. That said, -30 dB still means ~55 dB when listening with 2.83V of power, and 50 dB is normal conversation. So maybe it's not so crazy to look at bass output this low. In the case of Hotel California, the drums enter at 30 seconds into the song and they are played largely in isolation -- so it would not be masked by other sounds in the music.
The difference between the two amps is a small 2 dB, but that's within the threshold of what is accepted as an audible difference.
What's interesting is that at high SPLs, the REW sweep showed no indication of this in frequency response. At lower SPL, the ripple around 20 Hz was something that I subconciously blew off as an artifact on the REW sweep. I didn't see it until writing up this post. The real-world bass content is more likely to be lower than 0 dBFS.
I believe this harmonizes the objectivist/subjectivist perspective.
If you only saw the 0 dBFS sweep, you would see that the two frequency responses are identical in the bass region. A subjectivist would distrust measurements because he/she would hear something different in the bass and not see a difference. An objectivist would dismiss the subjectivist claim of differences in bass as mere sighted bias or poorly controlled studies. However, by running the sweep at a different level, there may in fact be a difference. The objectivist is justified in saying that only frequency response changes can be audible and the subjectivist is justified in seeing that there is a measurement that correlates with what was heard, but required an atypical measurement.
What I also have learned, and hopefully not incorrectly, is to pay more attention to the lower frequencies and slope of the bass roll-off rather than just look for the -3 or -6 dB threshold. For years, there is always a claim of sealed vs. ported sound characteristics yet the measurements of "speed" are hard to explain since speed is dictated by the frequency of the audio. Purely speculating, maybe the difference in bass roll off slope is just as important as the single -6 dB point. I'd be curious to see a LS3/5a on the Klippel NFS to see how the bass measures. Part of the reason I ignored the oscillation on the REW sweep with the Fosi V3 is that I thought it was inconsequential on a bookshelf that didn't extend that deep.
So what about the difference in voices?
If we scrutinize the vocal region, there are differences in the recorded, un-corrected comparisons. Again, RMS volume mismatch is 0.05 dB different, but the biggest delta in this region is as high as 2 dB which could be audible.

Looking at the difference in spectra, you can see that the spectra is pretty consistent from 30 to 300 Hz, again suggesting that my measurements are reasonably done, but you do see a bigger difference as you move up the frequency range which is even bigger than what is seen in the bass region.

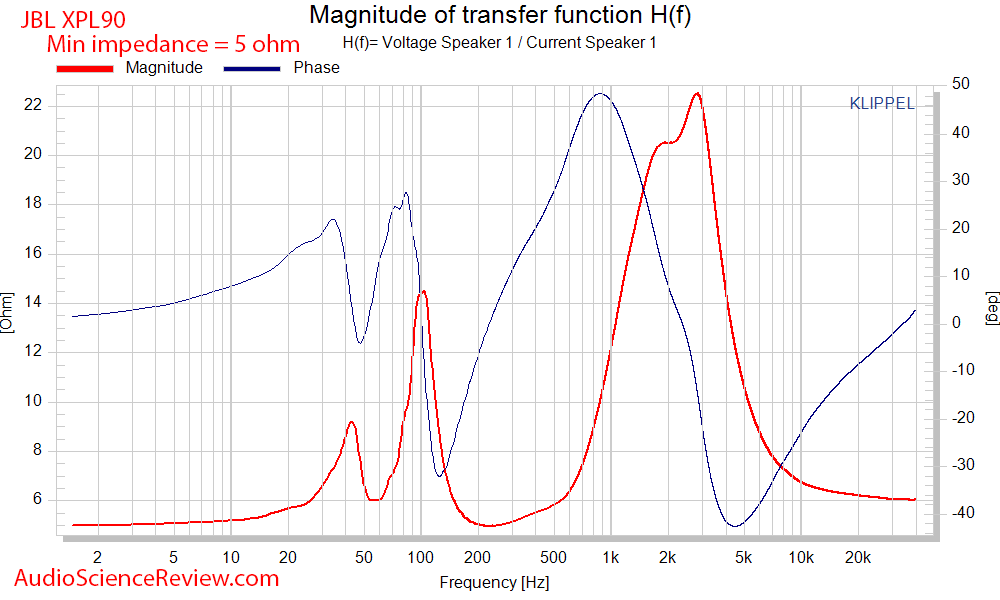
The XPL90 I used has this impedance/phase. I suppose the blip near 100 Hz in the delta of the spectra is an area that is a peak in both the phase and impedance, but I'm not seeing a pattern here and I don't know to how to calculate EPDR off a chart like this. Maybe this is harder to drive?
DF Metric and PK Metric are weighted metrics for performing the null test.


The PK Metric is looking at things throughout the entire spectrum, weighted perceptually, for a given point in time. The right image shows what results contributed the most to the calculation of the PK Metric and the two spikes are certainly within the region of the harmonics of the human voice.

The PK Metric of - 59.4 dBr isn't that high, but it may be due to PK Metric looking at things too broadly and being too strict. After all, we can accept that a drum solo with 2 dB of difference should be audible but the PK Metric doesn't really recognize this. I believe it's a moving average and if the drum solo is averaged with the guitar/voice, the PK Metric may assume that the bass is masked due to it being so much lower in dB than the "average" content in that sample bucket. We probably need some sort of ANOVA like calculation where any difference can result in detectable differences, and additional post-tests are needed to answer why.
Conclusion
There are two points to this post.
1. Two amplifiers with "good electrical performance" sounded different to my ears. While we know the Fosi V3 is load dependent, it translated into more of an issue that might be predicted. I was able to measure differences using a UMIK-2 that seem to correlate with my subjective experience. A "standard" sweep of 0 dBFS through a calibrated microphone would only have shown the high frequency differences of just 1 dB, which was not the biggest difference in my subjective impression. We talk about the advances in ADCs like the E1DA Cosmos ADC for measuring electrical performance, and I do believe that the UMIK-2 is a great tool for measuring speakers (at a fixed location).
2. I've compared a $90 and $9,000 MSRP product and presumably, you've read to this point. It says a lot about both products and the state of hi-fi. First, the $90 Fosi V3 shows the power of innovation and is a real showcase for Texas Instrument's Class D chip. It's sort of an incredible feat of engineering representing what is essentially a globally developed product. TI wouldn't be able to release a $90 integrated amplifier without a company like Fosi buying their chips and building the rest of the consumer product, nor would Fosi have been able to do this without the innovation of TI. When people work together, better things happen. My only comment on the Fosi is that the 32V power supply has UL listing while the 48V doesn't. While audio isn't the same as deep sea submersibles, I generally prefer to have certified products when the option is available or a product with a long pre-existing track record.
The $9,000 product is a clear demonstration of diminishing performance returns as you spend more money. On the other hand, much in the way one might spend a luxury vacation, there is an experience component to the audiophile hobby. The PM-10 would have delivered reliable Class D performance 7 years ago. Even if something like the Marantz Model 30 or even the 40n gives you the same audible experience within the power envelope, the luxury product delivered it earlier. Think ABS, driver assistance, and GPS -- luxury cars got it first.
As for the audible benefits of the luxury product? I certainly hear and prefer the difference, recognizing that I would never suggest that it is a "100X improvement". It was immediately noticed by me, but even 2 dB is subtle by any standard. I will leave it up to you to decide if the data presented is convincing enough that a difference between sound could in fact exist and that the difference could in fact reach audible thresholds. Neither amplifier hits the 120 dB SINAD threshold for absolute electrical transparency and the 5W electrical SINAD is ~87 vs ~101 dB.
I think I'm a pretty open-minded audiophile. I've sold off higher-end, more prestigious speakers after discovering that a Bose 901 Series VI worked fortuitously well in my room. I've returned, with restocking fees and shipping expenses, new gear that I should have been biased to like from the novelty alone. Sometimes, I get to recover my losses by selling off an expensive product that is bested or matched by a lower priced product.
How does the $90 Fosi Audio V3 compare to the $9,000 Marantz PM-10 integrated amplifier?
Scenario:
I was lent a Fosi Audio V3 integrated amp with a 48V power supply with the request to run some measurements on it to make it was performing to spec. There wasn't any issue with it -- the owner knew that I have amplifier test gear and was curious. My 5W SINAD is 86.9 dB which is good enough to match @amirm 's measurements. I did my tests with an E1DA Cosmos ADC (Grade A) and Vishay-Dale 1% non-inductive resistors. I used my Marantz SA-10 as a signal generator, so the test instrumentation is nowhere as good as the APx555. I also didn't spend a lot of time with grounding. The measurements show that it's a good sample.
The Fosi Audio V3 on test
You can actually keep pushing this harder and harder and the SINAD keeps getting better.
The Marantz PM-10 has a SINAD that breaks the 100 dB barrier. This was done with a 20-22.05 kHz range instead of 20-20kHz, so it's probably in the 101 dB range.
Setting up my Subjective Tests
My reference integrated amplifier is the Marantz PM-10 which is built around a bridged HypeX NC500OEMs/SMPS600 design (so 4 NC500's + 2 SMPS600) along with Marantz's own pre-amp and buffer. My go-to passive bookshelf is the JBL XPL90 which has the benefit of being tested on the NFS here.
First step was volume matching. This was done with a MinDSP UMIK-2 placed at the main listening position.
Calibrating Volume
I used REW to calibrate levels. Per my conversations with @JohnPM , REW will send out pink noise from 500 Hz to 2000 Hz (a "speaker calibration") signal based upon my standardized sweep. The Marantz SA-10 outputs a fixed voltage and the Marantz PM-10 has 0.5 dB volume precision while the Fosi V3 has an analog logarithmic potentiometer.
With a -10 dBFS test signal in REW, I adjusted the volume reported by "Check Levels" to show 80 dB at the listening position with the speaker calibration pink noise. I then ran two sweeps above and below that level: +0 dBFS and -20 dBFS.
Volume matching is better than the 0.5 dB you can achieve with the Marantz's volume control. I have pretty good dexterity, and I am at the limit of what can be done by adjusting the Fosi V3 knob. You can see that the Fosi in green/red is slightly louder in the treble relative to the Marantz. This is just 1 dB of difference or less.
Once I had this level of volume matching, I did my listening tests by unplugging the Fosi V3 so that I wouldn't have to touch the volume dial.
Subjective Impressions
I started with the Fosi V3 and listened to Hotel California. My first impression was "wow. I didn't remember my XPL 90 having this kind of bass." When the vocals came in, I was disappointed and it sounded recessed or less natural. My initial thought was that I was just noticing the limitation of the speaker. I swapped to the Marantz PM-10. As soon as the track started, I felt as if the guitars were more natural. But the bass didn't impress. It wasn't anemic - it just didn't surprise and delight. When the voices came in, it sounded wonderful -- the sort of giddiness or smile that you probably got when you heard this track on your first premium system. The soundstage and vocals were noticeably better on the PM-10, but no one could reasonably say that it was 100X better. For me, it was the difference between "a wow and a smile" and "I can't complain".
Measurements
After my subjective impressions, I decided to try something new. I moved my UMIK-2 back to the listening position and recorded the first 3 minutes of Hotel California on each system. A 48 kHz sampling rate was used. I then brought the recordings into @pkane 's DeltaWave for analysis.
DeltaWave v2.0.8, 2023-07-30T21:12:49.7348193-07:00
Reference: PM-10_HC.flac[?] 8704000 samples 48000Hz 24bits, stereo, MD5=00
Comparison: FOSI_V3.flac[?] 8729280 samples 48000Hz 24bits, stereo, MD5=00
Settings:
Gain:True, Remove DC:True
Non-linear Gain EQ:False Non-linear Phase EQ: False
EQ FFT Size:65536, EQ Frequency Cut: 0Hz - 0Hz, EQ Threshold: -500dB
Correct Non-linearity: False
Correct Drift:True, Precision:30, Subsample Align:True
Non-Linear drift Correction:False
Upsample:False, Window:Kaiser
Spectrum Window:Kaiser, Spectrum Size:32768
Spectrogram Window:Hann, Spectrogram Size:4096, Spectrogram Steps:2048
Filter Type:FIR, window:Kaiser, taps:262144, minimum phase=False
Dither:False bits=0
Trim Silence:False
Enable Simple Waveform Measurement: False
Discarding Reference: Start=0.5s, End=0s
Discarding Comparison: Start=0.5s, End=0s
Initial peak values Reference: -10.514dB Comparison: -10.419dB
Initial RMS values Reference: -29.814dB Comparison: -29.761dB
Null Depth=11.544dB
X-Correlation offset: -8818 samples
Drift computation quality, #1: Good (5.78μs)
Trimmed 0 samples ( 0.00ms) front, 0 samples ( 0.00ms end)
Final peak values Reference: -10.514dB Comparison: -10.487dB
Final RMS values Reference: -29.814dB Comparison: -29.821dB
Gain= 0.0656dB (1.0076x) DC=0.00001 Phase offset=-183.706567ms (-8817.915 samples)
Difference (rms) = -58.08dB [-60.46dBA]
Correlated Null Depth=49.58dB [43.33dBA]
Clock drift: -0.27 ppm
Files are NOT a bit-perfect match (match=0.63%) at 16 bits
Files are NOT a bit-perfect match (match=0%) at 24 bits
Files match @ 49.9994% when reduced to 9.35 bits
---- Phase difference (full bandwidth): 12.3807379864222°
0-10kHz: 12.16°
0-20kHz: 12.35°
0-24kHz: 12.38°
Timing error (rms jitter): 15.3μs
PK Metric (step=400ms, overlap=50%):
RMS=-59.4dBr
Median=-59.6
Max=-53.9
99%: -55.25
75%: -57.85
50%: -59.6
25%: -62.34
1%: -73.91
gn=0.992477307560239, dc=9.05811550542576E-06, dr=-2.72459687718413E-07, of=-8817.9151922137
DONE!
Signature: 6ff930734cc68b8179e8896c8c5fb6df
RMS of the difference of spectra: -106.566381971716dB
DF Metric (step=400ms, overlap=0%):
Median=-28.8dB
Max=-6.6dB Min=-41dB
1% > -39.75dB
10% > -37.08dB
25% > -33.65dB
50% > -28.79dB
75% > -25.01dB
90% > -21.44dB
99% > -12.66dB
Linearity 22.8bits @ 0.5dB error
DeltaWave shows that my volume matching was as good as it gets. 0.05 dB difference in RMS. Deltawave corrects this to 0.007 dB.
Initial RMS values Reference: -29.814dB Comparison: -29.761dB
If we look at the aligned spectra, which is the comparison *after* DeltaWave has done its level/phase adjustments, the white (FOSI V3) does have more content below 30 Hz than the blue (Marantz PM-10).
The JBL XPL90 is a bookshelf speaker, so it cannot reproduce anything this low with meaningful SPLs. It's -30 dB at 20 Hz. That said, -30 dB still means ~55 dB when listening with 2.83V of power, and 50 dB is normal conversation. So maybe it's not so crazy to look at bass output this low. In the case of Hotel California, the drums enter at 30 seconds into the song and they are played largely in isolation -- so it would not be masked by other sounds in the music.
The difference between the two amps is a small 2 dB, but that's within the threshold of what is accepted as an audible difference.
What's interesting is that at high SPLs, the REW sweep showed no indication of this in frequency response. At lower SPL, the ripple around 20 Hz was something that I subconciously blew off as an artifact on the REW sweep. I didn't see it until writing up this post. The real-world bass content is more likely to be lower than 0 dBFS.
I believe this harmonizes the objectivist/subjectivist perspective.
If you only saw the 0 dBFS sweep, you would see that the two frequency responses are identical in the bass region. A subjectivist would distrust measurements because he/she would hear something different in the bass and not see a difference. An objectivist would dismiss the subjectivist claim of differences in bass as mere sighted bias or poorly controlled studies. However, by running the sweep at a different level, there may in fact be a difference. The objectivist is justified in saying that only frequency response changes can be audible and the subjectivist is justified in seeing that there is a measurement that correlates with what was heard, but required an atypical measurement.
What I also have learned, and hopefully not incorrectly, is to pay more attention to the lower frequencies and slope of the bass roll-off rather than just look for the -3 or -6 dB threshold. For years, there is always a claim of sealed vs. ported sound characteristics yet the measurements of "speed" are hard to explain since speed is dictated by the frequency of the audio. Purely speculating, maybe the difference in bass roll off slope is just as important as the single -6 dB point. I'd be curious to see a LS3/5a on the Klippel NFS to see how the bass measures. Part of the reason I ignored the oscillation on the REW sweep with the Fosi V3 is that I thought it was inconsequential on a bookshelf that didn't extend that deep.
So what about the difference in voices?
If we scrutinize the vocal region, there are differences in the recorded, un-corrected comparisons. Again, RMS volume mismatch is 0.05 dB different, but the biggest delta in this region is as high as 2 dB which could be audible.
Looking at the difference in spectra, you can see that the spectra is pretty consistent from 30 to 300 Hz, again suggesting that my measurements are reasonably done, but you do see a bigger difference as you move up the frequency range which is even bigger than what is seen in the bass region.
The XPL90 I used has this impedance/phase. I suppose the blip near 100 Hz in the delta of the spectra is an area that is a peak in both the phase and impedance, but I'm not seeing a pattern here and I don't know to how to calculate EPDR off a chart like this. Maybe this is harder to drive?
DF Metric and PK Metric are weighted metrics for performing the null test.
The PK Metric is looking at things throughout the entire spectrum, weighted perceptually, for a given point in time. The right image shows what results contributed the most to the calculation of the PK Metric and the two spikes are certainly within the region of the harmonics of the human voice.
The PK Metric of - 59.4 dBr isn't that high, but it may be due to PK Metric looking at things too broadly and being too strict. After all, we can accept that a drum solo with 2 dB of difference should be audible but the PK Metric doesn't really recognize this. I believe it's a moving average and if the drum solo is averaged with the guitar/voice, the PK Metric may assume that the bass is masked due to it being so much lower in dB than the "average" content in that sample bucket. We probably need some sort of ANOVA like calculation where any difference can result in detectable differences, and additional post-tests are needed to answer why.
Conclusion
There are two points to this post.
1. Two amplifiers with "good electrical performance" sounded different to my ears. While we know the Fosi V3 is load dependent, it translated into more of an issue that might be predicted. I was able to measure differences using a UMIK-2 that seem to correlate with my subjective experience. A "standard" sweep of 0 dBFS through a calibrated microphone would only have shown the high frequency differences of just 1 dB, which was not the biggest difference in my subjective impression. We talk about the advances in ADCs like the E1DA Cosmos ADC for measuring electrical performance, and I do believe that the UMIK-2 is a great tool for measuring speakers (at a fixed location).
2. I've compared a $90 and $9,000 MSRP product and presumably, you've read to this point. It says a lot about both products and the state of hi-fi. First, the $90 Fosi V3 shows the power of innovation and is a real showcase for Texas Instrument's Class D chip. It's sort of an incredible feat of engineering representing what is essentially a globally developed product. TI wouldn't be able to release a $90 integrated amplifier without a company like Fosi buying their chips and building the rest of the consumer product, nor would Fosi have been able to do this without the innovation of TI. When people work together, better things happen. My only comment on the Fosi is that the 32V power supply has UL listing while the 48V doesn't. While audio isn't the same as deep sea submersibles, I generally prefer to have certified products when the option is available or a product with a long pre-existing track record.
The $9,000 product is a clear demonstration of diminishing performance returns as you spend more money. On the other hand, much in the way one might spend a luxury vacation, there is an experience component to the audiophile hobby. The PM-10 would have delivered reliable Class D performance 7 years ago. Even if something like the Marantz Model 30 or even the 40n gives you the same audible experience within the power envelope, the luxury product delivered it earlier. Think ABS, driver assistance, and GPS -- luxury cars got it first.
As for the audible benefits of the luxury product? I certainly hear and prefer the difference, recognizing that I would never suggest that it is a "100X improvement". It was immediately noticed by me, but even 2 dB is subtle by any standard. I will leave it up to you to decide if the data presented is convincing enough that a difference between sound could in fact exist and that the difference could in fact reach audible thresholds. Neither amplifier hits the 120 dB SINAD threshold for absolute electrical transparency and the 5W electrical SINAD is ~87 vs ~101 dB.
Last edited:
")

