I've added a discrepancy disclaimer (on my main thread, and on Focal Clear thread) to make sure people understand why it's -2dB now. Thanks for feedback.Thanks for this useful compilation. However, for the Focal Clear, the peak/dip filter at 11,319 hz should be +2 db. (You show it as -2.).

-
WANTED: Happy members who like to discuss audio and other topics related to our interest. Desire to learn and share knowledge of science required. There are many reviews of audio hardware and expert members to help answer your questions. Click here to have your audio equipment measured for free!
- Forums
- Audio, Audio, Audio!
- Headphones and Headphone Amplifier Reviews
- Headphone & IEM Reviews & Discussions
You are using an out of date browser. It may not display this or other websites correctly.
You should upgrade or use an alternative browser.
You should upgrade or use an alternative browser.
HEDD HEDDPhone Review (headphone)
- Thread starter amirm
- Start date
Bow_Wazoo
Addicted to Fun and Learning
- Joined
- Jan 3, 2021
- Messages
- 783
- Likes
- 683
So, yesterday I took a few hours to compare the he400i and the Heddphone.For today i brought the HE400i home.
Purely out of curiosity, i would like to make a direct comparison with the HEDDphone, after both have been optimized with regard to frequency response.
Both were adjusted according to the Harman curve (Amir & Oratory1990).
To anticipate one thing, so adjusted sounds the 400i in my opinion, considering the current price of 200 €, sensational!
However, it cannot hold a candle to the Heddphone in a direct comparison.
The HEDDphone scores with a much higher resolution, especially in the bass with more control, as well as more transparency and order.
I found the stage to be similar.
Is it bordering on madness, considering the performance of the 400i, to put 1400€ more for a HEDDphone and on the table?
Definitely!
Will I keep the HEDDphone?
Definitely!

I don't know if someone already posted the link, but here's where to buy the leather strap
https://www.ebay.com/itm/124324247890
OP
- Thread Starter
- #103
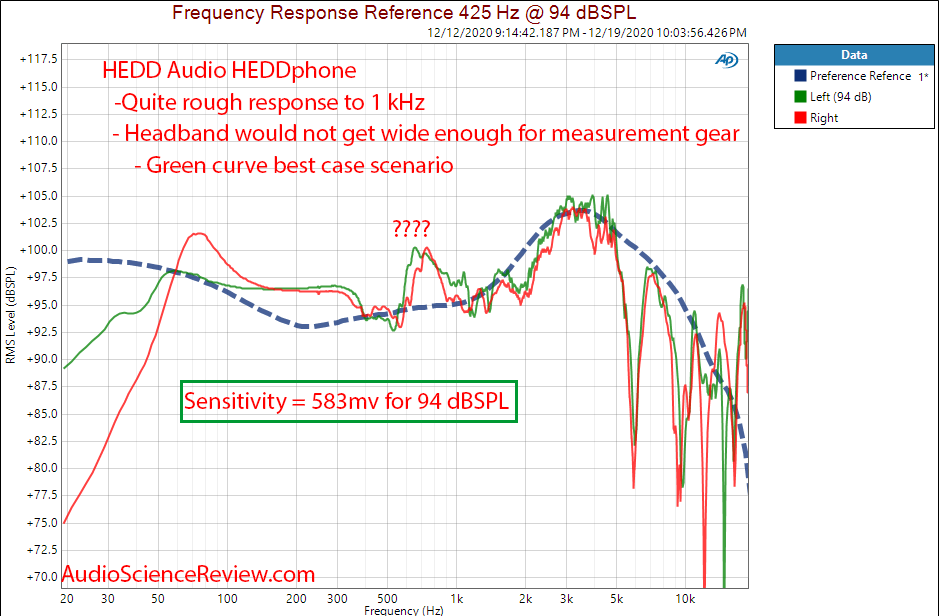
Not at all. His graph matches mine, sans the poor resolution of his:This matches the frequency response best to the Harman target as I quote Oratory describing here, as opposed to other measurements which use a fixed frequency for matching which can give a misleading depiction of tonality compared to the target.
The matching frequency I use is actually what is implicitly used in Harman research. Here is a slide with different preference graphs for example:
I have circled the matching frequency I use (425 Hz). As you see, that is the common point between the graphs.
A reason why this is a more accurate method is that the fixture provides some of its highest accuracy in this region. Bass gets impacted by the seal. Higher frequencies get impacted by reflections and smallest variations. That region in 400 to 500 Hz however, is broadly reliable so makes for a very good anchor.
The method I use then is objective and repeatable. The method of having the tester eyeball the graphs and move them up and down differently for every headphone, not so much.
Net, net, you conclusion is flat wrong. There is nothing better there.
- Joined
- Oct 13, 2018
- Messages
- 14
- Likes
- 14
I am the owner of the unit reviewed here. Without applying equalization, the treble distortion is not as audible. Once you apply the equalization, it is quite audible. Even though the bass distortion is low, the treble distortion is a real problem with this headphone.
Not at all. His graph matches mine, sans the poor resolution of his:
The matching frequency I use is actually what is implicitly used in Harman research. Here is a slide with different preference graphs for example:
View attachment 104247
I have circled the matching frequency I use (425 Hz). As you see, that is the common point between the graphs.
A reason why this is a more accurate method is that the fixture provides some of its highest accuracy in this region. Bass gets impacted by the seal. Higher frequencies get impacted by reflections and smallest variations. That region in 400 to 500 Hz however, is broadly reliable so makes for a very good anchor.
The method I use then is objective and repeatable. The method of having the tester eyeball the graphs and move them up and down differently for every headphone, not so much.
Net, net, you conclusion is flat wrong. There is nothing better there.
Amirm first of all. Thank You for Your great work. I really appreciate it
I know that You Don’t like Heddphones, their measurements are just horrible and probably You consider them overpriced... but I am planing to buy them coz I haven’t heard better soundung headphones to my ears
Could You Please recommend me some EQ preset for Rme Adi 2 paired with Heddphones? I would be very greatful
I am the owner of the unit reviewed here. Without applying equalization, the treble distortion is not as audible. Once you apply the equalization, it is quite audible. Even though the bass distortion is low, the treble distortion is a real problem with this headphone.
Do You consider them a bad choice? To be honest I had one week to test them. I consider them one of the best choice in their price range and I really loved them. I want to buy them coz they have this unique timbre and bass. Whole sound presentation is one of It’s kind. Do You consider buying them a mistake?
The pair of HEDDphones I bought for my subjective evaluation really impressed me from the first notes I heard on them. I did not hear distortion either equalized or unequalized. I thought the treble was their best trait. To my ears they were delicate and airy. They were sheer magic on female vocals. They very nearly won my comparison. In the end I preferred the Audeze LCD-3. The LCD-3’s treble and midrange nearly matched that of the HEDDs. The HEDDs just could not match the bass quality and quantity of the LCDs. I don’t consider myself a bass head but I do like clear, authoritative bass.
Martin
Martin
- Joined
- Oct 13, 2018
- Messages
- 14
- Likes
- 14
Do You consider them a bad choice? To be honest I had one week to test them. I consider them one of the best choice in their price range and I really loved them. I want to buy them coz they have this unique timbre and bass. Whole sound presentation is one of It’s kind. Do You consider buying them a mistake?
I bought these open box from headphones.com in June I think and really loved the sound right out of the box. To me it was clear and I could swear I didn't hear any distortion. I had the Beyerdynamic T1, Audeze LCD X, Verum 1 to compare and to me these sounded the best. Thing is, I wasn't using equalization at the time and so I guess I didn't really realize it but the distortion was sort of there, but hidden. Instead the region up to 300 Hz or so is what my brain focused on and that sounded really good.
Then after I got these back, I punched in the equalization, and then I heard the distortion. Of course the sound stage really improved, but by this time I also had the Focal Clear to compare and with equalization the focal clear sounds much, much better (I have no clipping issue as I can tolerate only 1.8 dB bass boost).
I think the measurements here are no lie and with equalization the distortion is definitely audible (to me). Having said that, I don't consider buying any headphone a mistake, it always just comes down to trying them out. Although I will be selling these soon.
Last edited:
Bow_Wazoo
Addicted to Fun and Learning
- Joined
- Jan 3, 2021
- Messages
- 783
- Likes
- 683
I also sold mine again.
Because from hour to hour I noticed the weight increasingly negative.
Now I've bought a Utopia.
Btw. some claim the HEDDphone is a flagship / Utopia killer.
In my opinion, the soundquality of the HEDDphone is far from Utopia
Because from hour to hour I noticed the weight increasingly negative.
Now I've bought a Utopia.
Btw. some claim the HEDDphone is a flagship / Utopia killer.
In my opinion, the soundquality of the HEDDphone is far from Utopia
OP
- Thread Starter
- #110
Hi there. These are the EQ settings you need to enter into RME:Could You Please recommend me some EQ preset for Rme Adi 2 paired with Heddphones? I would be very greatful
Unfortunately I have not used the RME EQ feature so I can't tell you how to enter them in there. Maybe someone else can.
In case you haven't seen it...Could You Please recommend me some EQ preset for Rme Adi 2 paired with Heddphones? I would be very greatful
Read the manual, which explains how to enter PEQ filters:
https://www.rme-audio.de/downloads/adi2dacr_e.pdf
As far I can tell, you won't need to set a preamp gain (as the unit doesnt care about that).
But just so you're aware...Amir's PEQ filters need a preamp gain of -7.5dB to avoid clipping.
I think the unit has 24 dB of internal headroom, so you should be good.
Hi there. These are the EQ settings you need to enter into RME:
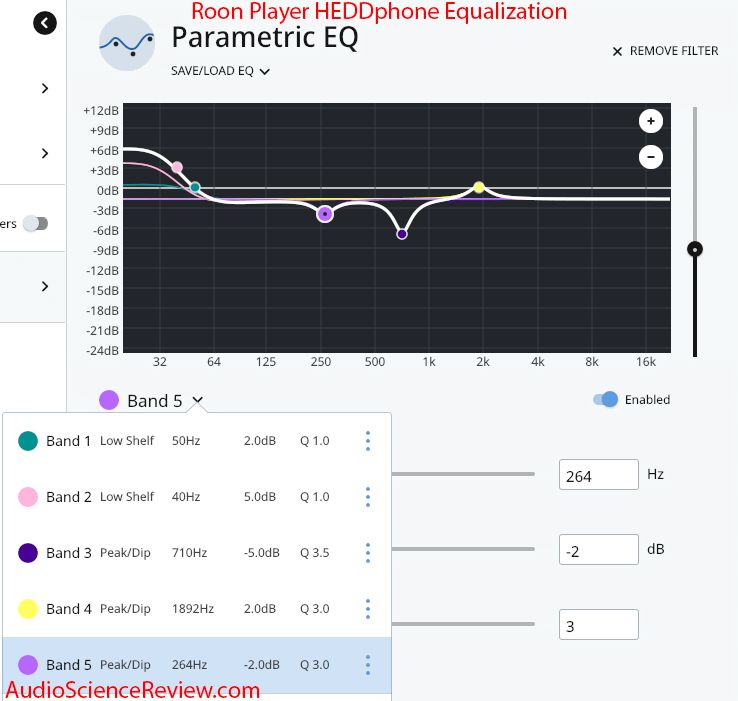
Unfortunately I have not used the RME EQ feature so I can't tell you how to enter them in there. Maybe someone else cann.
Omg... Thank You
I guess I am blind...In case you haven't seen it...
Read the manual, which explains how to enter PEQ filters:
https://www.rme-audio.de/downloads/adi2dacr_e.pdf
As far I can tell, you won't need to set a preamp gain (as the unit doesnt care about that).
But just so you're aware...Amir's PEQ filters need a preamp gain of -7.5dB to avoid clipping.
I think the unit has 24 dB of internal headroom, so you should be good.
Thank You a lot
Also shown here if you are a visual learner.Omg... Thank You
Thank You a lot
This headphones needs a proper amp to drive them, some EQ altering and will sound superb, there will be almost zero distortions. There is one thing about Heddphones that no one here mentioned, speed! I've never ever heard something that fast.
Last edited:

Attachments

That's one SMOOTH & FAST MOTHER....they even look aerodynamic!
Agreed, if you look at the music, not listen.That's one SMOOTH & FAST MOTHER....they even look aerodynamic!
OP
- Thread Starter
- #120
Sorry, there is no such thing as "speed." Typically this is lack of deep bass that people call "speed." Anyway, my conclusion is not far from yours in the review:This headphones needs a proper amp to drive them, some EQ altering and will sound superb, there will be almost zero distortions. There is one thing about Heddphones that no one here mentioned, speed! I've never ever heard something that fast.
But with the right EQ, for someone who has other headphones and wants to try something different, it can provide excellent soundstaging/layering of instruments and overall tonality.
Similar threads
- Replies
- 134
- Views
- 22K
- Replies
- 107
- Views
- 30K
- Replies
- 162
- Views
- 19K
- Replies
- 1K
- Views
- 155K
- Replies
- 778
- Views
- 80K