I never suggested that a watts measurement has anything to do with IM. I merely pointed out that the average consumer is constantly looking for more objective ways to evaluate speaker systems, partly because the industry has moved toward online purchases without listening tests in many cases. In such cases, they often erroneously latch onto published specifications, such as the power rating of a speaker system in watts, which has almost nothing to do with the sound quality or the SPL output of the speaker.IMD measurements are not the answer to that. Certainly no "watts" number jumps out of that measurement, especially if it is a spectrum and not a number.

-
WANTED: Happy members who like to discuss audio and other topics related to our interest. Desire to learn and share knowledge of science required. There are many reviews of audio hardware and expert members to help answer your questions. Click here to have your audio equipment measured for free!
You are using an out of date browser. It may not display this or other websites correctly.
You should upgrade or use an alternative browser.
You should upgrade or use an alternative browser.
GR Research LGK 2.0 Speaker Review (A Joke)
- Thread starter amirm
- Start date
- Joined
- Jan 15, 2020
- Messages
- 6,903
- Likes
- 16,917
Also Klippel seems to offer a multitone distortion measurement which Erin and Nuyes recently use, for example

source: https://www.erinsaudiocorner.com/loudspeakers/wharfedale_linton_85/

source: https://gall.dcinside.com/mgallery/board/view/?id=speakers&no=255172&search_head=110&page=1
In my experience it has a better correlation to audibility than the HD measurements which can be seen for example also in how the MD gets lower at single driver when a high-pass filter is used while a HD measurement would stay the same:
The test was conducted in (3) manners:
For information on how to read the below data, watch this video:


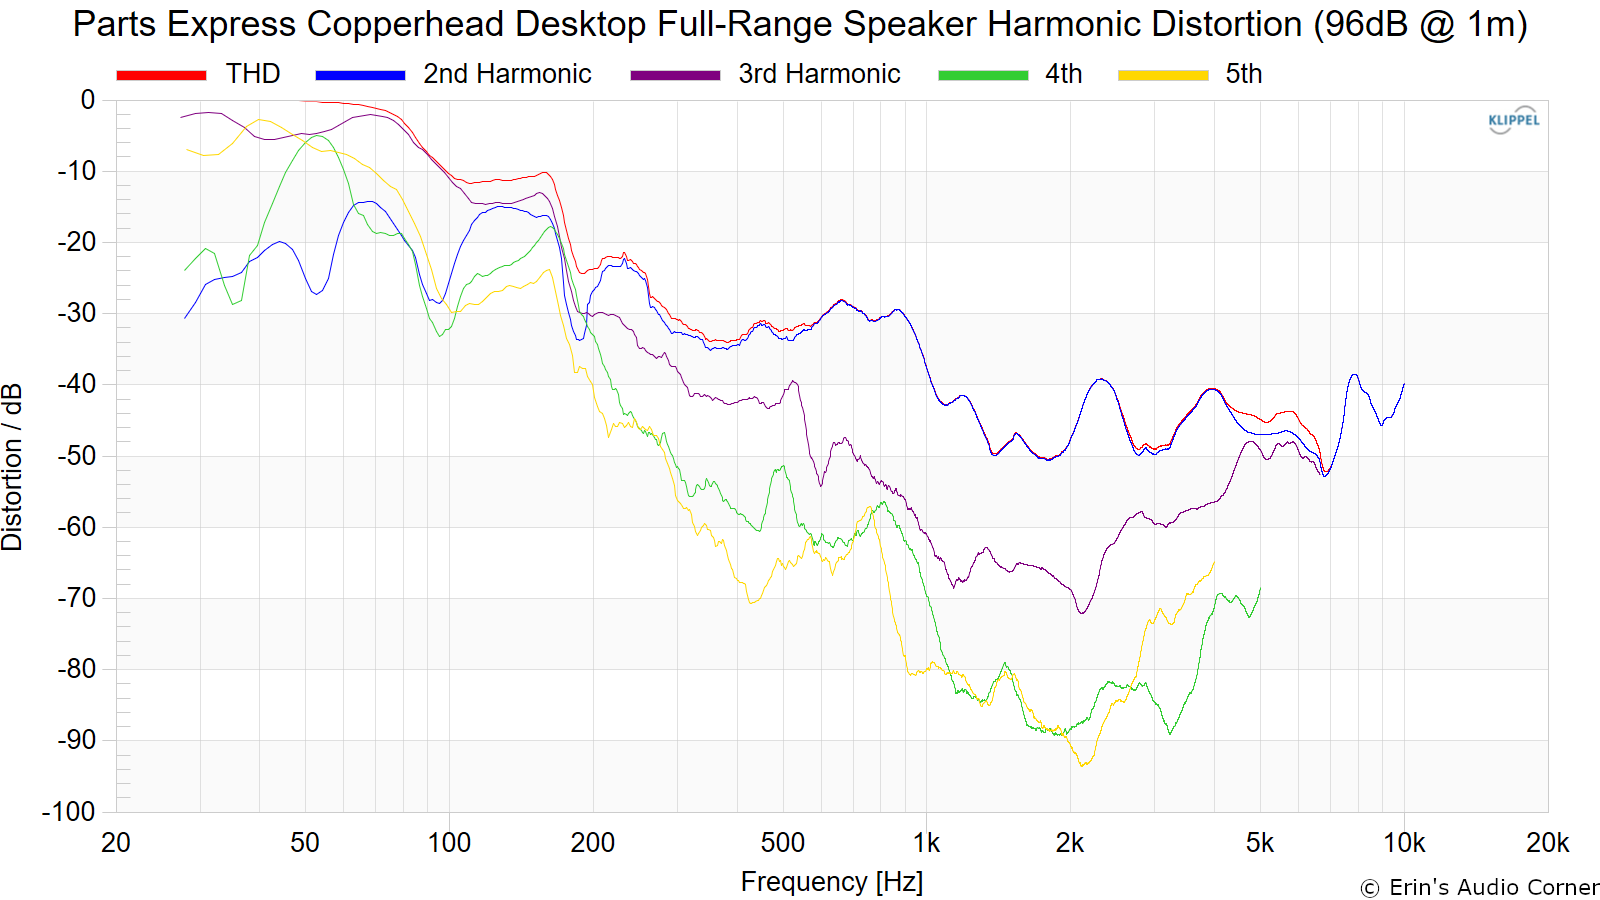
Direct Comparison (96dB @ 1m)

Source: https://www.erinsaudiocorner.com/loudspeakers/parts_express_copperhead/
I recently asked @JohnPM from REW if he can implement some similar test and visualisation in REW and he said he is looking into it.
source: https://www.erinsaudiocorner.com/loudspeakers/wharfedale_linton_85/
source: https://gall.dcinside.com/mgallery/board/view/?id=speakers&no=255172&search_head=110&page=1
In my experience it has a better correlation to audibility than the HD measurements which can be seen for example also in how the MD gets lower at single driver when a high-pass filter is used while a HD measurement would stay the same:
Multitone Distortion
The following tests are conducted at (4) approximate equivalent output volumes: 70/79/87/96dB @ 1 meter. The (4) voltages listed in the legend result in these SPL values.The test was conducted in (3) manners:
- Full bandwidth (20Hz to 20kHz)
- 100Hz to 20kHz
- 200Hz to 20kHz
For information on how to read the below data, watch this video:
- Full bandwidth (20Hz to 20kHz)
- 100Hz to 20kHz
- 200Hz to 20kHz
Direct Comparison (96dB @ 1m)
Source: https://www.erinsaudiocorner.com/loudspeakers/parts_express_copperhead/
I recently asked @JohnPM from REW if he can implement some similar test and visualisation in REW and he said he is looking into it.
Last edited:
OP
- Thread Starter
- #863
It doesn't though. With a single tone, we can easily perform psychoacoustic modeling of audibility. With dual tone, you are on your own. Modeling that masking effect becomes much harder. Add more tones and you really have no idea what is going on. There is no metric to apply to those graphs either. How do you compare one shape of graphs to another???In my experience it has a better correlation to audibility than the HD measurements which can be seen for example also in how the MD gets lower at single driver when a high-pass filter is used while a HD measurement would stay the same:
- Joined
- Jan 15, 2020
- Messages
- 6,903
- Likes
- 16,917
It does, there is a reason why Klippel offers them and Prof. Goertz does and show them, also see the advantage I showed above with a wide band driver when its high passed, we hear rather the MD at -10 or -20 dB than HD at -30 or -40.It doesn't though.
For example, the HD plot gives the impression that above 400 Hz the distortions are not very audible which is actually true for a single tone like a sine sweep since they are lower than 3% and actually mainly 2nd order, 3rd oder which is more audible is less than 1%:
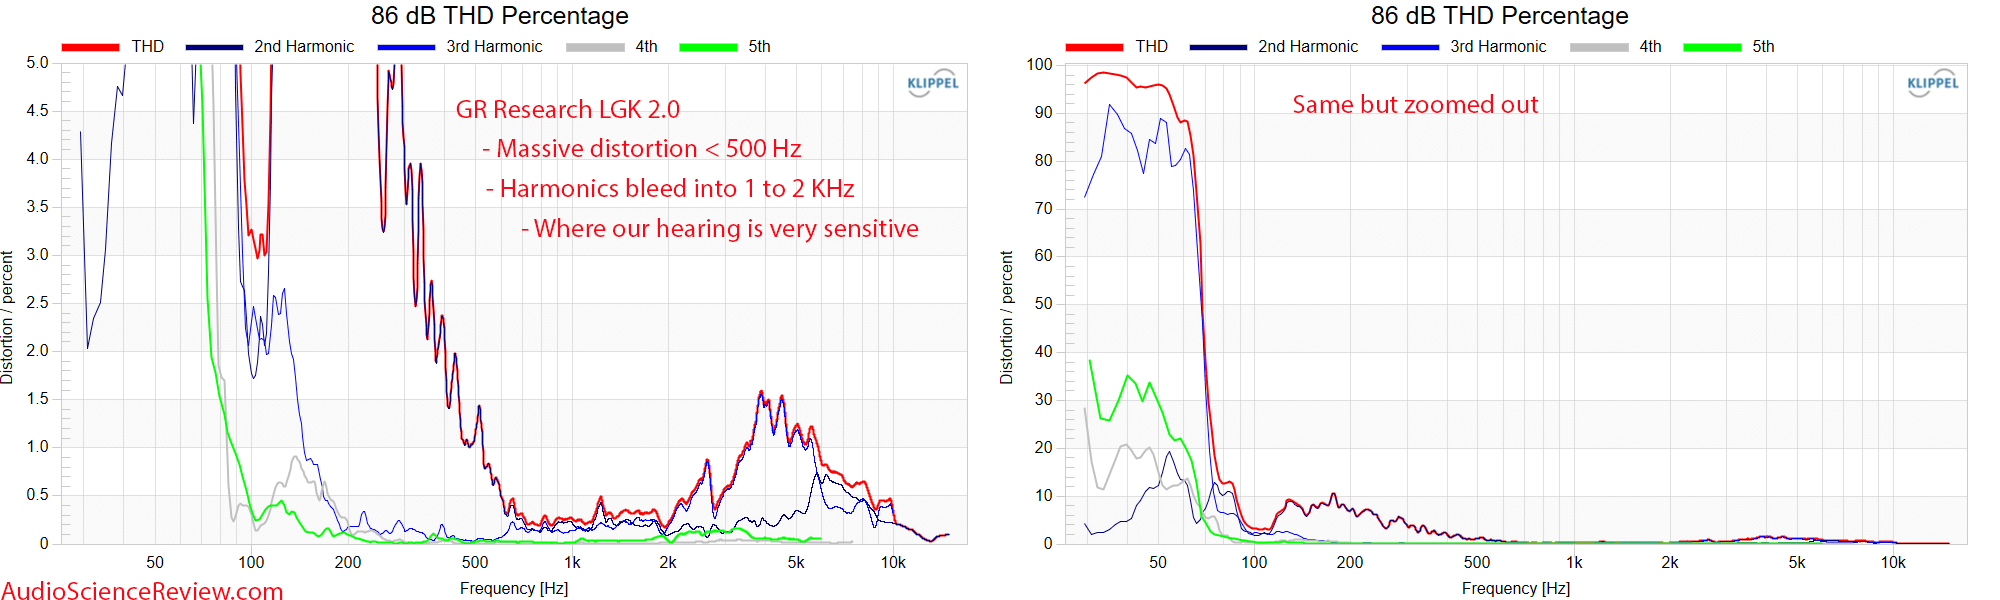
As you know from your review with the similar LGK such loudspeaker sounds extremely distorted though at the same level when playing music which has also at the same time a bass part, which can be seen at the multitone distortions which are at approximately 33%! (red curve):
Also as hearing experience tells with such small loudspeaker when they are sufficiently highpassed the audible distortion drops significantly which can be seen also by the more than 10dB drop above.
There are different issues, also I haven't seen any posted psychoacoustic evaluation at the typical HD plots shown?With a single tone, we can easily perform psychoacoustic modeling of audibility. With dual tone, you are on your own. Modeling that masking effect becomes much harder. Add more tones and you really have no idea what is going on.
Also it is not that I see no use in the HD plots, but they tell different things and I would rather have both complementing the distortion view of a loudspeaker. Neumann has some nice examples at pages 15-16 https://en-de.neumann.com/product_files/7950/download which show the significant multitone distortion difference of loudspeakers when the number of ways/drivers are increased, although the harmonic distortion measurements of all are low.
Like you compare HD plots, the higher the distortions are the more probable it is to hear them, same goes for the frequency regions where distortion is more audible.There is no metric to apply to those graphs either. How do you compare one shape of graphs to another???
OP
- Thread Starter
- #865
??? I do that routinely in my comments about the graph.There are different issues, also I haven't seen any posted psychoacoustic evaluation at the typical HD plots shown?
OP
- Thread Starter
- #866
That graph is no good because it is not showing you the ratio like you are using with IMD. For most cases, relative THD is far more important because it is responsive to frequency response variations.For example, the HD plot gives the impression that above 400 Hz the distortions are not very audible which is actually true for a single tone like a sine sweep since they are lower than 3% and actually mainly 2nd order, 3rd oder which is more audible is less than 1%:
OP
- Thread Starter
- #867
You don't need an IMD graph to tell you there was plenty of distortion with the LGK:As you know from your review with the similar LGK such loudspeaker sounds extremely distorted though at the same level when playing music which has also at the same time a bass part, which can be seen at the multitone distortions which are at approximately 33%! (red curve):
Notice my comments on the left graph. I am explaining audibility based on perceptual model which you can't do with IMD.
- Joined
- Jan 15, 2020
- Messages
- 6,903
- Likes
- 16,917
I mean a psychoacoustic model based metric not your listening impressions.??? I do that routinely in my comments about the graph.
The MD plots I posted above show also the relativ to fundamental distortions, here again:That graph is no good because it is not showing you the ratio like you are using with IMD. For most cases, relative THD is far more important because it is responsive to frequency response variations.
OP
- Thread Starter
- #870
That is exactly what I answered. And gave example of this very LGK speaker in the next post.I mean a psychoacoustic model based metric not your listening impressions.
OP
- Thread Starter
- #871
I know. But you compared it to an HD graph that wasn't. You can't make that comparison. You have to use relative distortion in both cases.The MD plots I posted above show also the relativ to fundamental distortions, here again:
OP
- Thread Starter
- #872
And what does that graph tell you? That it produces more distortion at 20 kHz than it does at 50 Hz in real life with music??? It ain't so....The MD plots I posted above show also the relativ to fundamental distortions, here again:
- Joined
- Jan 15, 2020
- Messages
- 6,903
- Likes
- 16,917
I also showed relative HD?I know. But you compared it to an HD graph that wasn't. You can't make that comparison. You have to use relative distortion in both cases.
You explain what you think happens which is wrong though, at normal listening to music with simultaneous bass not the approx. 1% 2nd harmonic distortion is what you hear but the multitone distortion which is magnitudes higher.You don't need an IMD graph to tell you there was plenty of distortion with the LGK:
Notice my comments on the left graph. I am explaining audibility based on perceptual model which you can't do with IMD.
How do you know? As you know from your listening tests of the LGK such loudspeakers have horrible "crackling" at large multitone levels sounds which have also a high upper frequency content.And what does that graph tell you? That it produces more distortion at 20 kHz than it does at 50 Hz in real life with music??? It ain't so....
I don't think it is fair to expect a speaker system that has only one 3" driver to play at 86 dB without distortion.You don't need an IMD graph to tell you there was plenty of distortion with the LGK:
Notice my comments on the left graph. I am explaining audibility based on perceptual model which you can't do with IMD.
Probably shouldn't market it as a giant killer, thenI don't think it is fair to expect a speaker system that has only one 3" driver to play at 86 dB without distortion.
")
I don't think it is fair to expect a speaker system that has only one 3" driver to play at 86 dB without distortion.
See if you think its a good desktop speaker for the price, buy it. But let others decide that its regarding the price, a poor desktop speaker. Or do you have some arguments that are interesting to listen too?
then don't say it's a giant Killer which it outdo those over it's size class... it's like calling a Mazda MX5 (miata) as a ferrari killer... it maybe good for it's size class, but not giant killerI don't think it is fair to expect a speaker system that has only one 3" driver to play at 86 dB without distortion.
mhardy6647
Grand Contributor
- Joined
- Dec 12, 2019
- Messages
- 11,405
- Likes
- 24,758
but, but, but... it's a little giant killer -- I guess that means it kills little giants, oxymoronic though that may be.
OP
- Thread Starter
- #879
It is more than fair. That is just 1 or two watts of power. Company itself shows driver response at 84 dBSPL:I don't think it is fair to expect a speaker system that has only one 3" driver to play at 86 dB without distortion.
And even brags about it on the website: "The LGK 2.0 uses a small 3″ wide-band driver providing a smooth response from to 80Hz to 20KHz and at an impressive 84dB."
If it is impressive at 84 dB, you think it should go to pieces at 86 dBSPL???
Remember, I have tested 250 speakers that passed this test. Company advertises that this speaker competes or "kills" many of them. It clearly does not if it can't handle 86 dBSPL. That they selected a small driver with just 1 mm of excursion is their problem, not mine or the customer who buys this.
It is certainly possible that a speaker that functions ok at 84 dB could go to pieces at 86 db. It's not a a matter of "should."If it is impressive at 84 dB, you think it should go to pieces at 86 dBSPL???
Remember, I have tested 250 speakers that passed this test. Company advertises that this speaker competes or "kills" many of them. It clearly does not if it can't handle 86 dBSPL. That they selected a small driver with just 1 mm of excursion is their problem, not mine or the customer who buys this.
I think it is perfectly fine to point out that it went to pieces at 86 dB, but I think it would have been best to test it at a lower dB levels, such as it might be used in a real world application of that speaker. In the real world, such as that system being used as a computer speaker, the listening distance may be only be one half meter or less. My computer speakers cannot play at 86 dB at one meter without distortion.
Personally, I think he should have tried designing a system with 2 or 3 those full range 3" drivers (without a crossover, but apparently with a notch filter. Obviously the impedance of the individual drivers would have to be adjusted to run them in parallel.
Similar threads
- Poll
- Replies
- 362
- Views
- 50K
- Replies
- 310
- Views
- 60K
- Replies
- 331
- Views
- 45K
- Replies
- 234
- Views
- 34K
- Poll
- Replies
- 65
- Views
- 13K