How do you combine the measurements?Sure, mirroring the horizontal axis is fine. But vertical can't be halved.
Also, remember, though, I am doing 2 sets of measurements for each axis - one ground plane and one free-space - to get anechoic-like data with full resolution down to 10hz. My window is > 100ms in most cases. I am not fond of using only gated measurements because of the extreme loss in resolution/accuracy. Most of the reviews I see have the window with resolution only down to 200hz or 300hz. That means a data point every 200 or 300hz step; that's not even 1-octave resolution. The bad thing about this is the low resolution hides high-Q anamolies in the midrange as well, for example, in the S400's response at around 500hz. The CEA 2034 spec discusses this issue as well:
"The requirement for 1/20-octave resolution cannot be achieved with windowed measurements except in the geometric center of very large, auditorium-sized, rooms. The lack of such resolution means that the nature of the low-frequency roll-off in loudspeakers is not accurately revealed and the audibility of medium- and high-Q resonances cannot be accurately estimated at lower frequencies in the amplitude response data."
So... trade-offs. To get high resolution I have to do an outdoors GP measurement and use that with Klippel's ISC module and an indoors measurement in order to get a room corrected, non-windowed response with high resolution. That's currently the best way to get the accuracy needed to provide meaningful results above 1kHz. Or, I can cut measurement time in half but also anything less than a couple octaves above the windowed frequency is not very useful. I know nearly everyone measures this way. Audioholics, nearly every DIY'r I know (myself included sometimes), and countless others. I'm not knocking it. I'm just pointing out that it's extremely limited in usefulness even a couple octaves above the gated frequency. There's no easy way to do this unless I purchase an anechoic chamber or the Near Field Scanner. :/
Anyway... just pointing out that I have to make twice as many measurements to get full resolution in a single axis. Doing that for 70 mic points means 140 measurements. I'll revisit some ideas and may mix and match methods as I see fit (for example, maybe not providing full spin data for items Amir has already tested and focus on other aspects like THD, fault finding analysis, max SPL, etc).

-
WANTED: Happy members who like to discuss audio and other topics related to our interest. Desire to learn and share knowledge of science required. There are many reviews of audio hardware and expert members to help answer your questions. Click here to have your audio equipment measured for free!
You are using an out of date browser. It may not display this or other websites correctly.
You should upgrade or use an alternative browser.
You should upgrade or use an alternative browser.
ErinsAudioCorner
- Thread starter hardisj
- Start date
OP
- Thread Starter
- #242
How do you combine the measurements?
I don't really "combine" them, per se. Not in the typical "splicing" sense. Klippel's ISC module does the dirty work for me. I provide it a "reference" (anechoic, ground plane, or NFS), provide in the In-situ measurement, tell it the conditions and it creates a room curve that takes the room out of the equation. But I have to do that for every angle because the room's influence is also dependent upon the relative radiation pattern. For a sealed woofer system this would change a bit but with a more complex design that's the way it is.
http://www.klippel.de/products/rd-system/modules/isc-in-situ-compensation.html
Post #233 has my reasons for why. At least, for now.
https://www.audiosciencereview.com/forum/index.php?threads/erinsaudiocorner.11219/post-412731
Thanks for pointing me to that. So, in summary, you do ground plane measurements as a reference point, having great resolution in the bass and midrange, but diminished accuracy (or greater error sensitivity) in treble. Then you do the same angular measurements gated on a platform, and Klippel combines the best qualities of both data sets?
In other words, you measure twice as many points with two different setups to get very high quality data.
Your comments on the resolution of gated measurements at bass and midrange are a BIG eye opener for me. It's very easy to assume that speakers are smooth in that region because you're only exciting them with big dumb bass frequencies, but the apparent smoothness is obviously due to fewer data points. Huge blind spot in DIY measurements, and something I've been following with great interest in the NFS measurements amir has been sharing. It would be very easy for a pretty audible resonance to go undetected in that region. Fortunately dispersion at those frequencies is fairly large, or at least non-chaotic, so you might be able to suss any issues out using nearfield/groundplane.
- Joined
- Feb 4, 2020
- Messages
- 194
- Likes
- 445
Look for a package to arrive in Alabama the latter part of June. ")
Ah, I misunderstood the way the ISC module works. I thought it meant you could do just one ground plane measurements and use that to 'fix' all the other polar measurements. Did not realize you had to repeat the process for every angle.
I definitely get the point about lower resolution. I cut off-axis measurements at 200hz myself, and it's not ideal. If you can get full low frequency resolution that's awesome!
But that said, when it comes to assessment of a speaker imo there are plenty of ways to get around that particular resolution flaw for resonances. They'll usually show up in the nearfield measurements, and when I'm curious about how that looks from different angles, I find just measuring from a few inches away at a few points is enough to minimize the influence of the room and identify any major resonances. And of course there's ground plane too, So for my own purposes, presenting a spin, I'm not very concerned about the lack of resolution there.
Personally, I think having a full spin is useful. But that said, if you don't want to do the full rear measurements to save some time, you can get quite close by just selecting a few key rear angles.
If you import the curves to vituixcad, adding just the 180 degree curve to the front hemisphere one should get you a nearly identical early reflections curve with monopole speakers.
For example, here's the >200Hz spin for the Amphion Argon1 with the full 19 rear measurements. This speaker has particularly loud port output, so it's kind of a worst-case scenario monopole.
 And here it is with just front hemisphere + the singular 180-degree measurement:

The sound power and DI curve suffers a bit at low frequencies but the others are imo close enough. I personally don't even care about the sound power with typical speakers anyway.
But if you want that last bit of detail, if you add just the +/- 120, and +/-150 measurements the spin should be virtually identical:

So doing a few rear measurements and letting VituixCAD fill in the gaps could be a good compromise.
I definitely get the point about lower resolution. I cut off-axis measurements at 200hz myself, and it's not ideal. If you can get full low frequency resolution that's awesome!
But that said, when it comes to assessment of a speaker imo there are plenty of ways to get around that particular resolution flaw for resonances. They'll usually show up in the nearfield measurements, and when I'm curious about how that looks from different angles, I find just measuring from a few inches away at a few points is enough to minimize the influence of the room and identify any major resonances. And of course there's ground plane too, So for my own purposes, presenting a spin, I'm not very concerned about the lack of resolution there.
Personally, I think having a full spin is useful. But that said, if you don't want to do the full rear measurements to save some time, you can get quite close by just selecting a few key rear angles.
If you import the curves to vituixcad, adding just the 180 degree curve to the front hemisphere one should get you a nearly identical early reflections curve with monopole speakers.
For example, here's the >200Hz spin for the Amphion Argon1 with the full 19 rear measurements. This speaker has particularly loud port output, so it's kind of a worst-case scenario monopole.
The sound power and DI curve suffers a bit at low frequencies but the others are imo close enough. I personally don't even care about the sound power with typical speakers anyway.
But if you want that last bit of detail, if you add just the +/- 120, and +/-150 measurements the spin should be virtually identical:
So doing a few rear measurements and letting VituixCAD fill in the gaps could be a good compromise.
Getting valid and accurate 360deg spin data below 500Hz is getting more and more important, because we start to have many commercial designs that aim for cardioid response or high directivity in that range. Another interesting finding from NFS has been BR port noise affecting directivity at wide angles. Passive resonators in 2-way speakers are problematic too and nearfield might not reveal the real summed effect because it skips phase shift caused by pathlength change at rotation.
About "calibration files" I suppose that off-axis differencies are small when a speaker is rotated, not the mic. Distances to room boundaries remain the same this way.
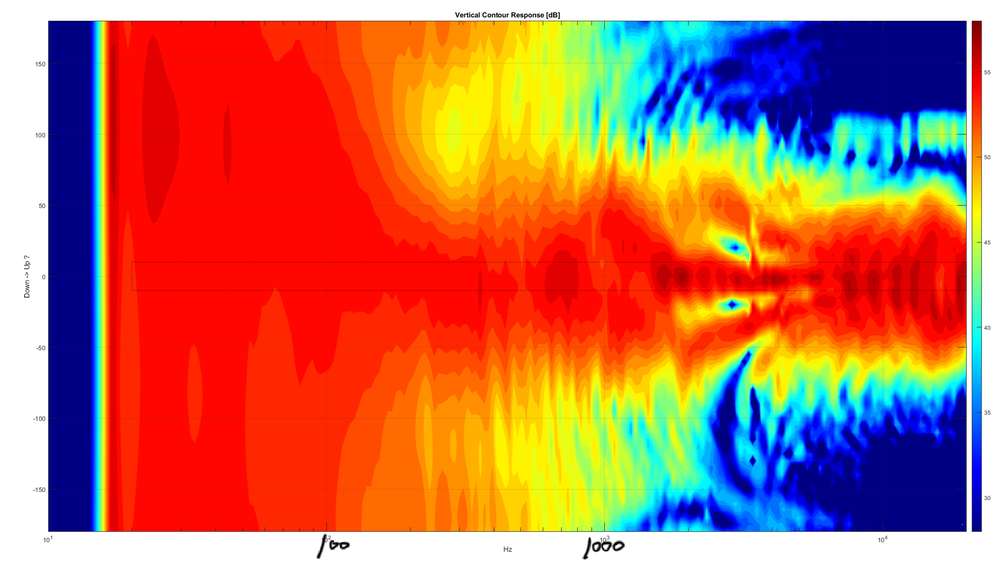
Height variance of speakers might be a problem though - a tall 3-way floorstander needs more distace for summing, typically xos are optimized to 2-3m distance. I can see this problem with NFS scans, like this Buchardt A700 floorstander - loudest bass +100 deg off-axis vertically (0 at tweeter level, was the speaker upside down?)
About "calibration files" I suppose that off-axis differencies are small when a speaker is rotated, not the mic. Distances to room boundaries remain the same this way.
Height variance of speakers might be a problem though - a tall 3-way floorstander needs more distace for summing, typically xos are optimized to 2-3m distance. I can see this problem with NFS scans, like this Buchardt A700 floorstander - loudest bass +100 deg off-axis vertically (0 at tweeter level, was the speaker upside down?)
Last edited:
In theory, this should not be a problem, since the NFS can extrapolate the measurement to any distance.Height variance of speakers might be a problem though - a tall 3-way floorstander needs more distace for summing, typically xos are optimized to 2-3m distance.
Didn't @Mads Buchardt say somewhere that Buchardt refers to measurements at a distance of 2m by default?
I can see this problem with NFS scans, like this Buchardt A700 floorstander - loudest bass +100 deg off-axis vertically (0 at tweeter level, was the speaker upside down?)
I think you're right, the lower part of the sonogram should show the measurement above the tweeter, because the upper part of the sonogram shows a narrowing in radiation in the frequency range above 1-2 kHz - the reason for this might be the baffle.
This would then also explain the slightly increased sound pressure in the low bass range in the upper part of the sonogram.
Whereby my statements are to be taken with caution because of the non-normalized representation of the sonogram.
OP
- Thread Starter
- #248
Ah, I misunderstood the way the ISC module works. I thought it meant you could do just one ground plane measurements and use that to 'fix' all the other polar measurements. Did not realize you had to repeat the process for every angle.
I definitely get the point about lower resolution. I cut off-axis measurements at 200hz myself, and it's not ideal. If you can get full low frequency resolution that's awesome!
But that said, when it comes to assessment of a speaker imo there are plenty of ways to get around that particular resolution flaw for resonances. They'll usually show up in the nearfield measurements, and when I'm curious about how that looks from different angles, I find just measuring from a few inches away at a few points is enough to minimize the influence of the room and identify any major resonances. And of course there's ground plane too, So for my own purposes, presenting a spin, I'm not very concerned about the lack of resolution there.
Personally, I think having a full spin is useful. But that said, if you don't want to do the full rear measurements to save some time, you can get quite close by just selecting a few key rear angles.
If you import the curves to vituixcad, adding just the 180 degree curve to the front hemisphere one should get you a nearly identical early reflections curve with monopole speakers.
For example, here's the >200Hz spin for the Amphion Argon1 with the full 19 rear measurements. This speaker has particularly loud port output, so it's kind of a worst-case scenario monopole.
View attachment 66037And here it is with just front hemisphere + the singular 180-degree measurement:
View attachment 66038
The sound power and DI curve suffers a bit at low frequencies but the others are imo close enough. I personally don't even care about the sound power with typical speakers anyway.
But if you want that last bit of detail, if you add just the +/- 120, and +/-150 measurements the spin should be virtually identical:
View attachment 66039
So doing a few rear measurements and letting VituixCAD fill in the gaps could be a good compromise.
Great info. I appreciate this. I need to get more familiar with VituixCAD. I have done a few things in it but not much past basic splicing and diffraction simulation. Using it to fill in gaps will likely be a good tool.
After having slept on this I realized do want to at least provide the early reflections curve because it tends to line up very well with the predicted in room response which also lines up very well to the actual spatially averaged in-room response in the instances I have seen thus far. Since the early reflections curve requires only a single additional measurement (180°) that's not an inconvenience and provides a very good idea of what you can expect in-room above the pressure region. So, I'll do that for sure.
However, sound power requires the full gamut; 70 measurements. That leaves me with a decision to make... a lot more measurements or a couple like @napilopez mentioned and then letting VituixCAD fill in those blanks. Alternatively, I was thinking I could just provide sound power for the gated portion of my response only but at that point I might as well just do the other measurements. I'll probably approach this decision on a "as needed" basis. Personally, I think the more useful data here is the early reflections data because, like we have all seen, this is highly predictive of typical speakers' in-room response. By "typical speakers" I mean non omni-directional speakers. Omni speakers would probably be a different story altogether. I'm just rambling at this point... bottom line is this will be TBD until I make the decision.
One thing I can always do if I am in a pinch for time, is to use the ground plane method indoors for gated response > 100hz. I would need to be more careful about proper tilting of the speaker and I still lose some resolution compared to the outdoors ground plane+indoors 4-pi but it's a nice alternative if I have a quick turnaround time or get overwhelmed. I guess the good thing about all of this is I don't *have* to stick to a particular method as long as I am clear about the method used and the limitations of said method. Still, it would be nice to provide high-resolution data.
Last edited:
OP
- Thread Starter
- #249
In theory, this should not be a problem, since the NFS can extrapolate the measurement to any distance.
Just to be clear we are all on the same page... I am not using the NFS. I wish I were. It would take a multi-day measurement and analysis process and boil it down to a couple hours. I miss the days of measuring raw drivers. I understand why so few people provide high-resolution speaker response data.
Great info. I appreciate this. I need to get more familiar with VituixCAD. I have done a few things in it but not much past basic splicing and diffraction simulation. Using it to fill in gaps will likely be a good tool.
After having slept on this I realized do want to at least provide the early reflections curve because it tends to line up very well with the predicted in room response which also lines up very well to the actual spatially averaged in-room response in the instances I have seen thus far. Since the early reflections curve requires only a single additional measurement (180°) that's not an inconvenience and provides a very good idea of what you can expect in-room above the pressure region. So, I'll do that for sure.
Just to be totally clear, the early reflections curve does technically require all the rear measurements from +/-90 to 180. However using just 90 degrees and 180 provides a good enough approximation for most speakers.
The CTA-2034A is written ambiguously on this but Todd Welti from Harman clarified the matter a few months back. The good news is since it is was also clarified the curve is a weighted averag(average of averages), the rear component doesn't affect the final calculation much for monopoles even if it's a bit off.
OP
- Thread Starter
- #251
Just to be totally clear, the early reflections curve does technically require all the rear measurements from +/-90 to 180. However using just 90 degrees and 180 provides a good enough approximation for most speakers.
The CTA-2034A is written ambiguously on this but Todd Welti from Harman clarified the matter a few months back. The good news is since it is was also clarified the curve is a weighted averag(average of averages), the rear component doesn't affect the final calculation much for monopoles even if it's a bit off.
Wow. I'm looking at the 3rd edition of Sound Reproduction and that's not obvious at all. Like you said, it appears it includes only +/- 90 and 180. That's a pretty significant oversight that should be addressed. Also, the "average of averages" part is good clarification.
Well, then, my situation just got a good deal more complex. It really boils down to time vs accuracy. Spend twice as much time gathering data to get high resolution or 2) use gated-only measurements to get full spin information but no low resolution in the midrange (a critical band). I prefer the former's accuracy/resolution. But goodness... at this rate I might as well make this a second job. Sheesh. Maybe from now on I will only test completely symmetric speakers. Sealed square enclosure with a concentric driver on every face. Then I could just measure a single 90 degree window and be done. LOL
OP
- Thread Starter
- #252
I think my OCD nature and my quest to really legitimize my efforts is causing me a lot of unwanted and unnecessary stress at this point in time. I'm just so neck-deep in this process that I haven't taken a chance to step back and tell myself there is no need to go full-tilt when that information already exists. I have spent the past two months testing my methods and I'm ready to move forward with testing and posting the reviews. I don't want to get bogged down in trying to capture full-spin data of the S400 since Amir has already covered it. So, at this point, I am half-tempted to stop with the FR portion of the S400 testing so I can do the review and get this speaker back to Mads.
Likewise, right now I have 3 speakers to review and all 3 have also been reviewed by Amir with full spin data. So, in cases where Amir has provided full spin data already I may just default to using his as a talking point when discussing subjective and objective analysis. I will make every effort to provide full spin data for future reviews where there is no overlap, however.
At the very least I will always provide frontal hemisphere data, though, just to make sure what I have lines up with what Amir has. But rather than re-hash the same thing, I will instead focus the extra time on providing information not provided by the NFS such as Max SPL, distortion, grille effects, and other 'studies' that may intrigue me from an analytical perspective. Moving forward there should be less overlap in what Amir and I test and between the two of us we can provide a wider range of high-resolution spin data.
Whew... that was therapeutic. What's your guys' hourly rate? LOL.
Wow. I'm looking at the 3rd edition of Sound Reproduction and that's not obvious at all. Like you said, it appears it includes only +/- 90 and 180. That's a pretty significant oversight that should be addressed. Also, the "average of averages" part is good clarification.
Well, then, my situation just got a good deal more complex. It really boils down to time vs accuracy. Spend twice as much time gathering data to get high resolution or 2) use gated-only measurements to get full spin information but no low resolution in the midrange (a critical band). I prefer the former's accuracy/resolution. But goodness... at this rate I might as well make this a second job. Sheesh. Maybe from now on I will only test completely symmetric speakers. Sealed square enclosure with a concentric driver on every face. Then I could just measure a single 90 degree window and be done. LOL
Yep, as discussed in that thread it seems even Toole got tripped up a bit. On page 133 he says about the early reflections curve that "Asymmetrical designs require both side walls and both left and right front -wall data points, bringing the sum to 26 measurements. All but one of these (the 180 ° measurement) are in the front hemisphere. " And as we now know from Welti's comments looking into the Harman Audio Test System files, that can't be right. Plus if you go back to the devantier paper that birthed the early reflections curve, matter become even clearer.
Unfortunately, the ambiguity of CTA-2034A led to quite a few discrepancies in the early reflections curve and PIR among different sources. I brought it up to VituixCAD's creator and he was kind enough to promptly issue a fix a couple of months back. And after Amir informed Klippel, they sent him a fix for the ER curve. It currently has to be applied manually but hopefully they will integrate it into the next NFS update. As I showed in that thread, that's why some of Amirs ER curves seemed to be smoother around the crossover than Harman's own.
P.S. As of the most recent update VituixCAD can also now export the individual ER curves(front, side, rear, ceiling, floor), which comes in handy for more detailed analysis of directivity behavior. And then you can average front side rear if you want the total horizontal reflections.
OP
- Thread Starter
- #254
I posted some test data in the Adam S2V thread and thought I would share the link here for those interested...
https://www.audiosciencereview.com/...m-s2v-studio-monitor-review.11455/post-417355
https://www.audiosciencereview.com/...m-s2v-studio-monitor-review.11455/post-417355
OP
- Thread Starter
- #255
All that being said, after much experimentation I found the spinoramas were nearly identical using only front hemisphere data on typical monopole speakers so long as I performed a single 180-degree measurement and allowed VituixCAD to interpolate the rest.
Question for you...
Let's say I wanted to measure a speaker at 4 angles: 0°, ±90° and 180°, can I tell VirtuixCAD to interpolate all 360° in 10 degree increments and export those to individual files? Or you mean you are using VCAD to interpolate internally to provide a resultant graph?
Question for you...
Let's say I wanted to measure a speaker at 4 angles: 0°, ±90° and 180°, can I tell VirtuixCAD to interpolate all 360° in 10 degree increments and export those to individual files? Or you mean you are using VCAD to interpolate internally to provide a resultant graph?
Both! For individual angles, go to File>Export>Polar Frequency Responses. That will export all angles at once in whatever 'Angle Step' setting you have set in the options menu, including the interpolated ones. (Or at least, I assume so; I've only tried it with 10 degrees.)
The same Export menu has the option to export the main 7 spinorama curves individually, or you can do it all at once (along with the 5 Early Reflections components), by clicking on Export CTA-2034A data. You can save that information in various file types; If you export as a CSV it all gets saved into a single file, and if you export as txt they get saved as separate files. I prefer the latter as it's easy to drag and drop into REW.
BTW I was reading a part of Toole's book again and he says that at the NRC he used 90/120/150/180 for the rear hemisphere portion of the sound power, so there's some merit to using that to save some time.
OP
- Thread Starter
- #257
Both! For individual angles, go to File>Export>Polar Frequency Responses. That will export all angles at once in whatever 'Angle Step' setting you have set in the options menu, including the interpolated ones. (Or at least, I assume so; I've only tried it with 10 degrees.)
The same Export menu has the option to export the main 7 spinorama curves individually, or you can do it all at once (along with the 5 Early Reflections components), by clicking on Export CTA-2034A data. You can save that information in various file types; If you export as a CSV it all gets saved into a single file, and if you export as txt they get saved as separate files. I prefer the latter as it's easy to drag and drop into REW.
BTW I was reading a part of Toole's book again and he says that at the NRC he used 90/120/150/180 for the rear hemisphere portion of the sound power, so there's some merit to using that to save some time.
Ok. Thanks!
I tried importing some horizontal and vertical files in to VCAD last week. They imported fine. Showed the angles correctly in the import box. But the plots showed nothing. I was confused. Gave up. I'll need to try again... I'm sure it's something simple I'm missing.
I have decided I will just suck it up and go forward with capturing full spin data. That way I have it if I need it. But it's good to know I can use VCAD to maybe shave some time off here and there. I may also let it go ahead and create the CEA files to save myself the headache of writing it all in Matlab (though, I've already written half of what I need, ugh).
@hardisj, it's a really simple solution! To get anything started in vituixcad with regards to plots, you just need to go to the crossover tab, then draw a line from one red dot to the other. That's how you 'power on' the theoretical super full-range driver you're 'designing' in VCAD. Then as soon as you import the files, assuming they are all labeled correctly (you can set how to label horizontal and vertical measurements in the 'options' menu), it will automatically generate all the relevant curves and plots.
OP
- Thread Starter
- #259
@hardisj, it's a really simple solution! To get anything started in vituixcad with regards to plots, you just need to go to the crossover tab, then draw a line from one red dot to the other. That's how you 'power on' the theoretical super full-range driver you're 'designing' in VCAD
Seriously, though, thanks for letting me know. I was staring at the screen, clicking everywhere, checking settings... couldn't figure it out for the life of me!
OP
- Thread Starter
- #260
@hardisj, it's a really simple solution! To get anything started in vituixcad with regards to plots, you just need to go to the crossover tab, then draw a line from one red dot to the other. That's how you 'power on' the theoretical super full-range driver you're 'designing' in VCAD. Then as soon as you import the files, assuming they are all labeled correctly (you can set how to label horizontal and vertical measurements in the 'options' menu), it will automatically generate all the relevant curves and plots.
Quick follow up question. When you have a mirrored horizontal response (such as +10 being the same as -10, 20, 30, etc), do you need to do anything additional ... like import the file twice or explicitly name the files ± 10, 20, etc? I guess it doesn't matter if it's an overall average but I just want to make sure.
Similar threads
- Replies
- 18
- Views
- 1K
- Replies
- 29
- Views
- 4K
- Replies
- 25
- Views
- 1K
- Replies
- 17
- Views
- 2K