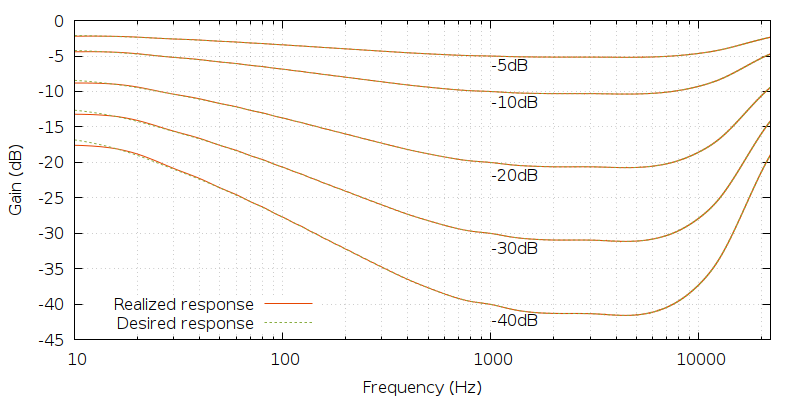
It has been a while since this post but I was wondering if you could share the exact source of the curves above. When I google ISO 226:2003 curves I get something different, that is:ok, I get your point now,
first, it was never sugested that it creates perfect compensation.....for this the algorythm would have to be made for the specific listener ear anyways.
second, while not exactly true, the "spacing between the levels" are kind of linear.
the following is a graph of the ISO 226:2003 curves, relative to a reference level of 90dB (the flat uper border).
if you look at your 50Hz and the reference frequency of 1000Hz > let's say we have the 50Hz at 90dB and the 1000Hz at 80dB. now we attenuate 10dB via the algorythm. you get -6ish for 50Hz and -10dB for 1000Hz.
now if you do the same for a starting point with 50Hz at 84ish and 1000Hz at 90dB. now we attenuate 10dB via the algorythm. you get about 6ish for 50Hz again and -10dB for 1000Hz.
View attachment 100746
it obviously will never be perfect.....but it will be much better than hearing only half the music.
but hear for yourself: listen to Rebecca Pidgeon's rendition of Spanish Harlem -40dB below you reference level,
and then compare to this -40dB loudness compensated version (at your reference level): https://drive.google.com/file/d/11LjGW8E4Uqx4X17oKYvToJQrGTbzy-w9/view?usp=sharing
ISO 226:2003 curves - Bing images
