• WANTED: Happy members who like to discuss audio and other topics related to our interest. Desire to learn and share knowledge of science required. There are many reviews of audio hardware and expert members to help answer your questions. Click here to have your audio equipment measured for free!

Beta Test: Multitone Loopback Analyzer software

In Freq sweep it does this thing that it did in an earlier version,it looks like is still generating something after the sweeps are done (see the green bar)
I don't know if it would be of any use to measure the output to see if there is an actual signal,my DMM is true RMS only up to 1000Hz,so...


generate.PNG
 
Ok,that's a strange one and I'll describe it in steps.

- I choose 1Khz sine measurement in dbr units,I do it,all fine.
- I change the measurement to silence and the units to dbfs.The moment I do that the measurement changes back itself to 1Khz sine again.
And vice versa.
It's not random,but it's not rock solid consistent too.
 
Ok,that is my last for today and it's not something broken.
Can we please (big please) have a ready made Intersample Overs test signal in our drop down list?
I'm curious to see how the dacs I can measure would handle them.
 
Ok,that is my last for today and it's not something broken.
Can we please (big please) have a ready made Intersample Overs test signal in our drop down list?
I'm curious to see how the dacs I can measure would handle them.

Intersample overs are just clipping due to interpolation. Any test signal that has samples near 0dBFS can cause interpolation to exceed 0dBFS, resulting in clipping. The test could then consist of any of the usual test signals in MT that contain peak values near, but below 0dBFS. I'm not sure if there's a specific test signal that would be better than any other to detect these.
 
Intersample overs are just clipping due to interpolation. Any test signal that has samples near 0dBFS can cause interpolation to exceed 0dBFS, resulting in clipping. The test could then consist of any of the usual test signals in MT that contain peak values near, but below 0dBFS. I'm not sure if there's a specific test signal that would be better than any other to detect these.
What I have seen is a 1,1,0,0 (or, 1,1,-1-1) sequence or similar (e.g. 1,1,1,1,-1,-1,-1,-1) to look for intersample over issues. Basically an "ideal" full-scale square wave at Nyquist/2 or Nyquist/4.
 
Intersample overs are just clipping due to interpolation. Any test signal that has samples near 0dBFS can cause interpolation to exceed 0dBFS, resulting in clipping. The test could then consist of any of the usual test signals in MT that contain peak values near, but below 0dBFS. I'm not sure if there's a specific test signal that would be better than any other to detect these.
To tell the truth I was carried away by the description here ( scroll down at about the middle of the page) so I thought it should be constructed a certain way.
But your description is straightforward,so I'll try it!
 
Ok,with 0.33db positive gain I'm 0.01db away from clipping and my peak is at -0.71dbr.
I'm I there?


spectrum.PNG

spectrum


0.33.PNG

waveform
 
I'm not sure if there's a specific test signal that would be better than any other to detect these.

There are at least two typical test signals, proposed at the time by TC, see old AES papers: A square wave at 7350 Hz with 60° phase shift, giving +1.25 dBFS level, and 11.025 kHz at 45° phase shift, giving +3.01 dBFS - both at 44.1 kHz sample rate. These are not produced by 'normal' square generators as they would not use that fixed and not very logical phase value for the sample points.
 
Ok,with 0.33db positive gain I'm 0.01db away from clipping and my peak is at -0.71dbr.
I'm I there?


View attachment 259286
spectrum


View attachment 259287
waveform

Looks like intersample overs, since your peak value is -0.71dB yet there's clipping. Not clear where the clipping is occurring, though, since it could also be in the ADC ;)
 
There are at least two typical test signals, proposed at the time by TC, see old AES papers: A square wave at 7350 Hz with 60° phase shift, giving +1.25 dBFS level, and 11.025 kHz at 45° phase shift, giving +3.01 dBFS - both at 44.1 kHz sample rate. These are not produced by 'normal' square generators as they would not use that fixed and not very logical phase value for the sample points.
That's a weird signal,level dances between -0.4 and -0.8db during the test!
(and I got to exactly 0db peak)


7350.PNG
 
Looks like intersample overs, since your peak value is -0.71dB yet there's clipping. Not clear where the clipping is occurring, though, since it could also be in the ADC ;)
Anything above 0db (and sometimes below) is clipping my ADC,so...
 
There are at least two typical test signals, proposed at the time by TC, see old AES papers: A square wave at 7350 Hz with 60° phase shift, giving +1.25 dBFS level, and 11.025 kHz at 45° phase shift, giving +3.01 dBFS - both at 44.1 kHz sample rate. These are not produced by 'normal' square generators as they would not use that fixed and not very logical phase value for the sample points.

Any pointers to these AES papers? A quick search found some ASR and DIY forum mentions of similar test signals, but no papers that I could find...
 
That's a weird signal,level dances between -0.4 and -0.8db during the test!
(and I got to exactly 0db peak)

You have no phase control. The correct waveform would look like this in MT (I dragged the file onto it, stereo channels intentionally phase inverted):

7350 Hz.jpg
 
Last edited:
Any pointers to these AES papers? A quick search found some ASR and DIY forum mentions of similar test signals, but no papers that I could find...
Various, but basically you don't need them. This is the main information from a paper called '0dBFS+ Levels in Digital Mastering, SØREN H. NIELSEN AND THOMAS LUND, TC Electronics', presented at the 109th Convention 2000 September 22-25, doc number might be 5251, where they tested very old CD players with these signals.

3.1 Phase and Level
The synchronously sampled sine waves were generated with two start phases: One with the theoretical
maximum value present as a sample value in the digital domain and one with the highest possible analog
peak level within the limitation of +/-1 in the digital domain.
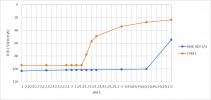
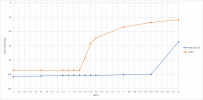
5512.5 Hz: 90 and 67.5°. At 67.5° the analog peak level is up to +0.69 dBFS.
7350 Hz: 90 and 60°. At 60° the analog peak level is up to +1.25 dBFS.
11025 Hz: 90 and 45°. At 45° the analog peak level is up to +3.0 dBFS.

This kind of stuff has been shown several times by other ASR members in self-built signals. And it can be changed to 48 kHz easily with the same results (11.025 becomes 12.000 etc).
 
There are at least two typical test signals, proposed at the time by TC, see old AES papers: A square wave at 7350 Hz with 60° phase shift, giving +1.25 dBFS level, and 11.025 kHz at 45° phase shift, giving +3.01 dBFS - both at 44.1 kHz sample rate. These are not produced by 'normal' square generators as they would not use that fixed and not very logical phase value for the sample points.
Sine, or square waves? For some reason I thought the AES used sine waves but have not been a member for many years. The half-Nyquist, 45 degree signal is one I have used for other applications than audio but for the same reason (to check for out-of-bound nastiness).
 
Well, it's a signal that consists only of 4 sample points...As mentioned above they are computed from sine waves, but in the editor they will look like squares...
 
Last edited:
11025 Hz: 90 and 45°. At 45° the analog peak level is up to +3.0 dBFS.
it can be changed to 48 kHz easily with the same results (11.025 becomes 12.000 etc).
Just tried the 12kHz Sine wave at 45° with the RME ADI-2/4 Pro SE
Output +13dBu 48kHz
ADC is RME UCX II 192kHz
THD is computed on 50kHz BW

I used the UCX II to be able to set a different sampling frequency for input than output, and then measure some THD (if limited).
(Note that the THD is probably limited by the UCX II ADC itself, so don't look at the absolute number, just the trend.)

You see that this signal is providing overs, but that, as from -0.3dB, and lower, there is no longer any overload.
That's because the ADI-2/4 allows intersample overloads up to +2.7dB.
(And we are just above 0.1% THD at +3dB)

1674490170827.png


Then, one may compare to the Topping D90LE

1674491846332.png


Would be great to be able to produce such plots.
 

Attachments

  • 1674491248420.png
    1674491248420.png
    19 KB · Views: 61
  • 1674491276135.png
    1674491276135.png
    36.3 KB · Views: 61
Last edited:
Wow...Now I'm jealous,I need a new machine!
(The old one just doesn't die!)

Just keep running 16M FFTs, it'll die in no time :)

I actually did a 32M FFT, as well. The first time took about 5 minutes to complete, the second time only about 15 seconds.
 
Back
Top Bottom