OP
- Thread Starter
- #2,181
Thanks! It actually worked to my benefit for that post. The bug that became a feature")
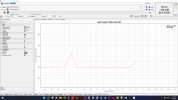
You probably know this, but if you want to show only the available data in the measurement range, just click on the 'Freq' label above the plot. It'll zoom in to set the minimum and maximum frequency for the plot to match your selected bandwidth.