
-
WANTED: Happy members who like to discuss audio and other topics related to our interest. Desire to learn and share knowledge of science required. There are many reviews of audio hardware and expert members to help answer your questions. Click here to have your audio equipment measured for free!
You are using an out of date browser. It may not display this or other websites correctly.
You should upgrade or use an alternative browser.
You should upgrade or use an alternative browser.
Beta Test: Multitone Loopback Analyzer software
- Thread starter pkane
- Start date
OP
- Thread Starter
- #2,162
Oh, I didn't even notice the labels. RMS level is shown correctly, isn't it? THD is showing as 0 is because there is no fundamental to measure.But the graph is showing rms level at -90 something and thd+ n around 0. that doesnt make sense.
The entire graph shows rms level at like -98db. I’m not understanding how that is correct? Also it shows thd+n at 0 instead of a large negative number. Why wouldnt each point in the graph be relative to the fundamental level at that frequency?Oh, I didn't even notice the labels. RMS level is shown correctly, isn't it? THD is showing as 0 is because there is no fundamental to measure.
OP
- Thread Starter
- #2,164
The entire graph shows rms level at like -98db. I’m not understanding how that is correct? Also it shows thd+n at 0 instead of a large negative number. Why wouldnt each point in the graph be relative to the fundamental level at that frequency?
Currently, dBr applies to fundamental and harmonics calcuations, and therefore affects THD and THD+N, as well as harmonics amplitudes, not noise or general signal levels.
Since your fundamental was at the level of the noise floor (non-existent), THD was 0dB, and therefore THD+N was also zero -- all harmonics were at the same level as the fundamental, and so dBr units moved them up to 0 dBr.
Last edited:
OP
- Thread Starter
- #2,165
The ratio of fundamental amplitude to the harmonics is 1, since they are both at the noise floor level. 20*Log10(1) is 0dB.Also it shows thd+n at 0 instead of a large negative number.
Sorry I’m being dense here, but why are you saying fundamental was at the noise floor? It should have been close to 0db for the entire sweep.Currently, dBr applies to fundamental and harmonics calcuations, and therefore affects THD and THD+N, as well as harmonics amplitudes, not noise or general signal levels.
Since your fundamental was at the level of the noise floor (non-existent), THD was 0dB, and therefore THD+N was also zero -- all harmonics were at the same level as the fundamental, and so dBr units moved them up to 0 dBr.
OP
- Thread Starter
- #2,167
Your spectrum showed no fundamental above noise floor:Sorry I’m being dense here, but why are you saying fundamental was at the noise floor? It should have been close to 0db for the entire sweep.
OP
- Thread Starter
- #2,169
Sorry I meant the pic before that of the sweep. It was at 0db output from the dac and so into the cosmos adc about -3db.
There was still no fundamental there, as far as I can tell, since the RMS and peak levels of the signal were way, way below -3dB.
I'm lost as to what you're looking at and what you posted and why. Are these all different results with different configurations? If so, I'm not sure what the issue is or what you want me to look for.
The only thing I see across all of these is that the RMS level of the signal is very low, consistent with no test signal (just noise) going into the ADC. From the sweep result:
I don’t understand it but post 2156 was just me switching post 2154 results to 20-24000 as you had suggested. Then I got that weird result in 2156. No idea why that would have happened just switching freq range. Ad you can see playback is still at 0db in both. On the spectrum post pic, I just clicked on spectrum tab from the sweep I did in post 2156.There was still no fundamental there, as far as I can tell, since the RMS and peak levels of the signal were way, way below -3dB.
I'm lost as to what you're looking at and what you posted and why. Are these all different results with different configurations? If so, I'm not sure what the issue is or what you want me to look for.
The only thing I see across all of these is that the RMS level of the signal is very low, consistent with no test signal (just noise) going into the ADC. From the sweep result:
View attachment 234229
Guess I need to try everything again.
OP
- Thread Starter
- #2,171
I don’t understand it but post 2156 was just me switching post 2154 results to 20-24000 as you had suggested. Then I got that weird result in 2156. No idea why that would have happened just switching freq range. Ad you can see playback is still at 0db in both. On the spectrum post pic, I just clicked on spectrum tab from the sweep I did in post 2156.
Guess I need to try everything again.
Something else changed other than the measurement range. There was no signal being output to the ADC from the DAC. The RMS and peak values are measured directly from the captured data and they showed that there was no 1khz fundamental above the noise floor.
Rantapossu
Addicted to Fun and Learning
- Joined
- Jul 21, 2022
- Messages
- 513
- Likes
- 362
Is there a scaling bug when using the different sample rates?
Works with WASAPI, the frequency range on the graph is following the WASAPI INPUT device (Don't be fooled with the naming of the "Hi-Fi Cable" devices, they shoud be like this, you'll have to think them as a pipe):

But it doesn't work with ASIO when changing the sample rate of the INPUT device:

It does however kind of work when changing the ASIO OUTPUT sample rate:

This prevents the measurement of the filters because you have to use the lower sample rate with the output device and not with the input device.
Should the scaling follow the input device here as well?
Works with WASAPI, the frequency range on the graph is following the WASAPI INPUT device (Don't be fooled with the naming of the "Hi-Fi Cable" devices, they shoud be like this, you'll have to think them as a pipe):
But it doesn't work with ASIO when changing the sample rate of the INPUT device:
It does however kind of work when changing the ASIO OUTPUT sample rate:
This prevents the measurement of the filters because you have to use the lower sample rate with the output device and not with the input device.
Should the scaling follow the input device here as well?
Last edited:
OP
- Thread Starter
- #2,173
Is there a scaling bug when using the different sample rates?
Works with WASAPI, the frequency range on the graph is following the WASAPI INPUT device (Don't be fooled with the naming of the "Hi-Fi Cable" devices, they shoud be like this, you'll have to think them as a pipe):
View attachment 234234
But it doesn't work with ASIO when changing the sample rate of the INPUT device:
View attachment 234235
It does however kind of work when changing the ASIO OUTPUT sample rate:
View attachment 234236
This prevents the measurement of the filters because you have to use the lower sample rate with the output device and not with the input device.
Should the scaling follow the input device here as well?
The same ASIO device can’t use two different rates, one for input, the other for output. When you use WASAPI shared, Windows might be doing the resampling to the "desired" rates for you, without you realizing it. The device is likely still running at just one rate for both, in and out. The way to measure at different sampling rate than the playback device is to use two separate devices with separate device drivers.
Last edited:
Sokel
Master Contributor
- Joined
- Sep 8, 2021
- Messages
- 6,111
- Likes
- 6,180
Particularly about the 192K output of the E-mu:Is there a scaling bug when using the different sample rates?
Works with WASAPI, the frequency range on the graph is following the WASAPI INPUT device (Don't be fooled with the naming of the "Hi-Fi Cable" devices, they shoud be like this, you'll have to think them as a pipe):
View attachment 234234
But it doesn't work with ASIO when changing the sample rate of the INPUT device:
View attachment 234235
It does however kind of work when changing the ASIO OUTPUT sample rate:
View attachment 234236
This prevents the measurement of the filters because you have to use the lower sample rate with the output device and not with the input device.
Should the scaling follow the input device here as well?
If is similar to what 0204 does,needs an external PS near to 1A to play right (I'm talking about music) without crackels,distorted sounds,etc.
In MT (without ext PSU,haven't try with) shows just inferior to lower sample rates,it handles 192K output but struggles with it a little.
On the other hand input is more than OK,records 192K just fine.
Maybe one of the issues is just that.
Last edited:
OP
- Thread Starter
- #2,176
If you look at the bottom the rate used for input and output is 96k. If you don’t see two rates on the status bar, the same rate was used for both.Also (I just found out) strangely seems to record even 384K just fine.
I don't know if it's really happening...
View attachment 234305
Sokel
Master Contributor
- Joined
- Sep 8, 2021
- Messages
- 6,111
- Likes
- 6,180
That's what 192K does,cant do more averages though,have to put the ext. PSU I think.If you look at the bottom the rate used for input and output is 96k. If you don’t see two rates on the status bar, the same rate was used for both.
")
OP
- Thread Starter
- #2,179
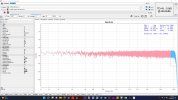
With version 1.50 it seems like the graph is getting cut off beyond my 20-20 range. Is there something that prevents me from seeing the whole spectrum? While it's measuring and averaging, I see everything.
*** Edit ***
it only happens when I am recording in stereo as opposed to mono
************
View attachment 234168
View attachment 234169
If you want a version that doesn't truncate the stereo result at measurement bandwidth, feel free to start using this early v1.0.51:
https://app.box.com/s/qbrh3czrvudclkqs9n8lm806k3hzmjx5
Similar threads
- Replies
- 10
- Views
- 653
- Poll
- Replies
- 49
- Views
- 16K
- Replies
- 12
- Views
- 985
- Replies
- 26
- Views
- 2K
- Replies
- 65
- Views
- 6K