
-
WANTED: Happy members who like to discuss audio and other topics related to our interest. Desire to learn and share knowledge of science required. There are many reviews of audio hardware and expert members to help answer your questions. Click here to have your audio equipment measured for free!
You are using an out of date browser. It may not display this or other websites correctly.
You should upgrade or use an alternative browser.
You should upgrade or use an alternative browser.
Share your in-room measurements?
- Thread starter thefsb
- Start date
OK, that explains.
How did you create the filter? Is measurement == corrected under 1KHz, and why? Thank you!
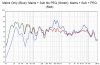
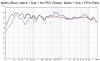
I wanted to know what the difference between a stereo moving mic measurement and a calculated average is. Remeasured. Turns out that root mean square averages in REW underestimate the summed response by a fair bit, especially in the bass. So I had to change bass equalization to reduce sub bass/low bass. The final stereo sum as measured (black) versus calculated (yellow). But before I reapplied EQ, I missed my target by a fair bit. Way more sub bass than expected from calculated average.

Individual channels and measured stereo sum, matched at HF:

I implemented a harman curve, this means I cut bass:

Due to speaker placement (I suppose), I needed some boost around 200-300 Hz because there is a cancellation, maybe due to distance to sidewalls. Anyway, used low Q filters and it sounds alright. The new measured response is rougher than before between 300 and 100 Hertz. I suppose because of slightly asymmetric placement and maybe in some places because of PEQ-induced phase shift, there are ugly peak/cancelation intervals. But it is quite hard yo avoid them in my current room, so maybe I will leave them for now.
Individual channels and measured stereo sum, matched at HF:
I implemented a harman curve, this means I cut bass:
Due to speaker placement (I suppose), I needed some boost around 200-300 Hz because there is a cancellation, maybe due to distance to sidewalls. Anyway, used low Q filters and it sounds alright. The new measured response is rougher than before between 300 and 100 Hertz. I suppose because of slightly asymmetric placement and maybe in some places because of PEQ-induced phase shift, there are ugly peak/cancelation intervals. But it is quite hard yo avoid them in my current room, so maybe I will leave them for now.
Last edited:
How did you create the filter? Is measurement == corrected under 1KHz, and why? Thank you!
In this case, that's the result of GLM (Genelec) calibration system without any tweaking.
- Joined
- Oct 10, 2020
- Messages
- 806
- Likes
- 2,638
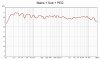
After trying many variants in the last months, this is the latest REW-generated EQ correction I'm using (and so far enjoying):


- Target -0,6 dB per octave slope
- A single manual high-shelf filter (f=250Hz, Q=0,8, gain=-4dB) to restore some low bass energy balance without cranking the sub and to combat SBIR cancellation
- Negative/subtractive filters only (no boosts), but allowing sharp filters below 200Hz
- Correct only between 20-600Hz
Are the dips between 1.5-4 KHz audible, I would assume yes since it exceeds 3db at 2.4KHz? Have you tried correcting it?
- Joined
- Oct 10, 2020
- Messages
- 806
- Likes
- 2,638
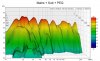
These are in my understanding the result of the loudspeaker's vertical directivity (i.e. floor/ceiling bounce and not LW or horizontal reflections) so I found really no audible benefit in correcting it.Are the dips between 1.5-4 KHz audible, I would assume yes since it exceeds 3db at 2.4KHz? Have you tried correcting it?
Though it does make for a nicer looking graph if I do correct it!

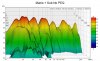
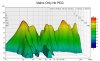
Here's my in-room measurements.
Room = 15ft x 19ft x 8ft.
Speakers 3 ft from front wall 6'6'' spacing.
Listening seat centered with head position ~ 9ft from speakers.
Measuring microphone ECM8000 at mid ear position connected to pc via Steinberg UR12.
All REW plots have 1/6 smoothing.
PEQ applied via JRiver, I am considering more advanced DSP options for the future.
Attachments
Here's my in-room measurements.
Room = 15ft x 19ft x 8ft.
Speakers 3 ft from front wall 6'6'' spacing.
Listening seat centered with head position ~ 9ft from speakers.
Measuring microphone ECM8000 at mid ear position connected to pc via Steinberg UR12.
All REW plots have 1/6 smoothing.
PEQ applied via JRiver, I am considering more advanced DSP options for the future.
Nice! What speaker/sub is this with?
looks quite ok, what speaker you're using?Here's my in-room measurements.
Room = 15ft x 19ft x 8ft.
Speakers 3 ft from front wall 6'6'' spacing.
Listening seat centered with head position ~ 9ft from speakers.
Measuring microphone ECM8000 at mid ear position connected to pc via Steinberg UR12.
All REW plots have 1/6 smoothing.
PEQ applied via JRiver, I am considering more advanced DSP options for the future.
- Joined
- May 31, 2020
- Messages
- 590
- Likes
- 989
Why is the “full band” correction, from 20-20k, not preferred? Any views on this?
- Correct only between 20-600Hz
I also correct only till about 400 hz, but why?
- Joined
- Oct 10, 2020
- Messages
- 806
- Likes
- 2,638
Below the room's transition frequency (normally between 200-300Hz in domestic rooms) human perception of sound cannot really differentiate between loudspeaker's direct radiated sound and 'room sound', which is here dominated by room modes. Above the transition frequency we get increasingly better at perceptually separating the direct sound coming from the loudspeaker and various reflections, which we perceive as spatiality.Why is the “full band” correction, from 20-20k, not preferred? Any views on this?
I also correct only till about 400 hz, but why?
Correcting the response above the transition frequency might make the sound better or worse (depending on a number of parameters that I will not go into here), while correcting below the transition frequency is IME always beneficial. IMHO if the loudspeakers measure well anechoically, there's really no need to EQ them above the transition frequency anyway.
Lately I've even simplified my filters significantly, to correct only between 20-200Hz and use only low-Q (<5) subtractive filters. I must say I'm very happy with the sound (even if the graph looks a little bit less tidy than before
):- Joined
- Oct 10, 2020
- Messages
- 806
- Likes
- 2,638
It would beAlways good to see results from others, I am not too familiar with all measurement protocols but the chart shows average of around 45 dB, is that a little low?
, but this was not an SPL-calibrated measurement so the absolute level in the graph is not correct. In reality level was probably around 75dB SPL.Similar threads
- Replies
- 18
- Views
- 1K
- Replies
- 44
- Views
- 3K
- Replies
- 2
- Views
- 238
- Replies
- 21
- Views
- 2K
- Replies
- 4
- Views
- 578