• WANTED: Happy members who like to discuss audio and other topics related to our interest. Desire to learn and share knowledge of science required. There are many reviews of audio hardware and expert members to help answer your questions. Click here to have your audio equipment measured for free!

Review and Measurements of Benchmark DAC3

OP
amirm

amirm

Founder/Admin
Staff Member
CFO (Chief Fun Officer)
Joined
Feb 13, 2016
Messages
44,654
Likes
240,798
Location
Seattle Area
OP
amirm

amirm

Founder/Admin
Staff Member
CFO (Chief Fun Officer)
Joined
Feb 13, 2016
Messages
44,654
Likes
240,798
Location
Seattle Area
OK, the DAC3 HGC that Benchmark was kind enough to send arrived today. So I put it on the bench and ran a few tests. I will be on the road tomorrow late morning so if you want to have anything else measured (hopefully not!), ask right away.

NOTE: all measurements are using balanced output unless noted, with -10 dB jumper applied as the original review.

Let's start with our Dashboard view:
Benchmark DAC3 HGC Dashboard Measurement.png


Right away we see a 2 dB or so improvement in SINAD/reduction of distortion compared to the loaner unit I had from @dallasjustice.

Let's look at the contested Jitter measurements using Benchmark's own ASIO driver:
Benchmark DAC3 HGC Jitter and Noise Measurement.png


We see a substantial improvement in jitter sidebands. We went from -108 dB or so to -131 dB!

No, it had nothing to do with using ASIO4ALL:

Benchmark DAC3 HGC ASIO driver difference Measurement.png


As you see, it makes no difference which driver is used. Both generate the identical, much improved results.

For completeness, let's run through the rest of our tests:

Benchmark DAC3 HGC THD+N Measurement.png


We see a marked improvement in low frequency noise/distortion (in green/brown). Gone is also the varying channel response that I saw (in red) in the first unit I tested. This matches our dashboard view of better THD+N/SINAD.

Here is IMD vs level and comparison to some other devices I had tested later, specifically Oppo UDP-205:

Benchmark DAC3 HGC IMD vs Level Measurement.png


The Benchmark DAC3 HGC (in red) has substantially lower noise than all the other DACs I have tested. It starts to saturate a bit at maximum level where it then runs into Oppo UDP-205. But otherwise beats it handily.

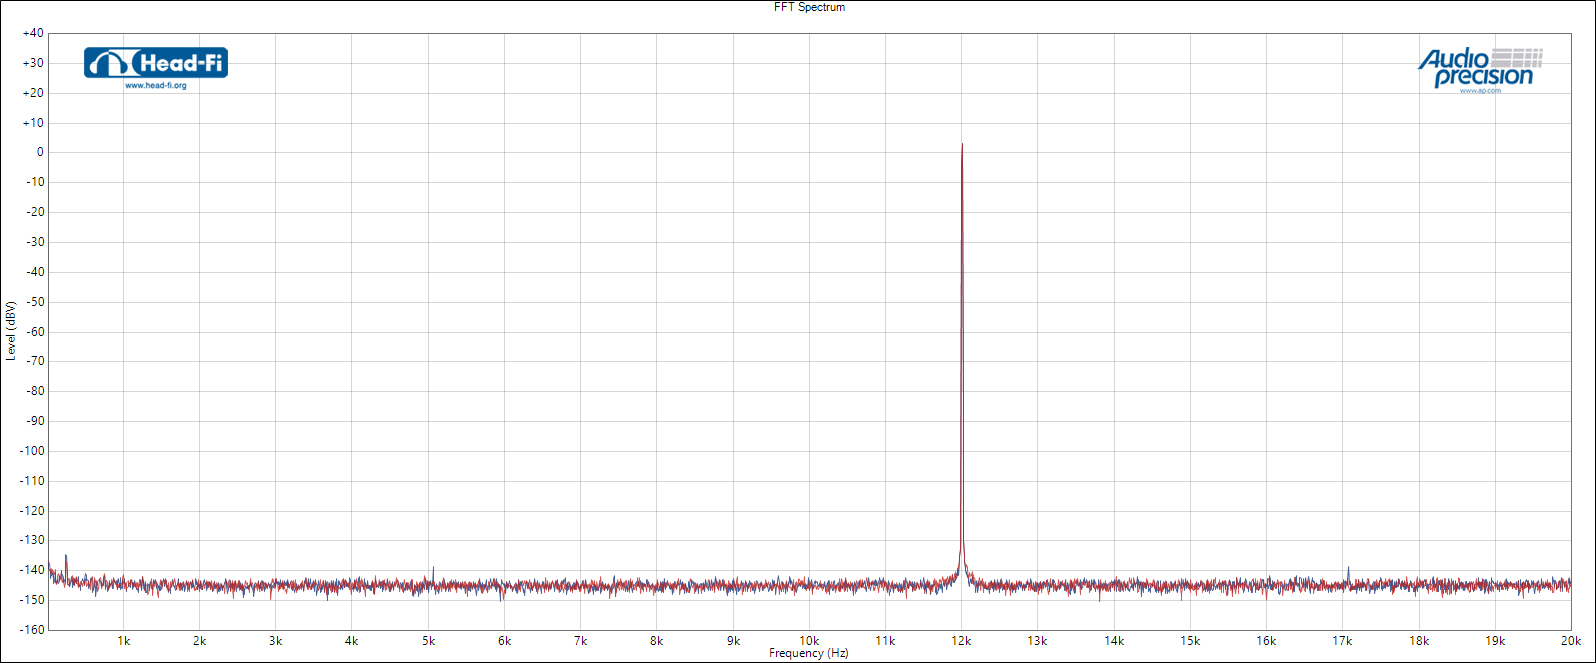
And here is the spectrum of 1 kHz distortion and noise (saved for future reference):
Benchmark DAC3 HGC 1 kHz Measurement.png


Distortion products are well under -120 dB, satisfying our even most conservative standard for audibility or better said, lack thereof.

Finally, linearity:
Benchmark DAC3 HGC Balanced Linearity Measurement.png


Using balanced output (which is used in all of the tests above), the DAC3 nails the performance here. There is something you don't see in these graphs which is how much my analyzer struggles to get stable set of measurements. With every DAC I have tested, it usually times out and picks the last value at lower amplitudes. Not so with Benchmark DAC3. The results instantly converge allowing the analyzer to run through all the values. There is exceptional engineering here to generate such stability and precision at such low amplitudes.

Alas, the small blemish on unbalanced output remains.

Summary
This second loaner unit of Benchmark DAC3 (HGC) finally lives up to the standard and reputation of Benchmark as a company. Measurements are exceptional with no faults found anywhere. OK, there is a setback in linearity for unbalanced output but otherwise, this is as good it gets guys.

It is a puzzler as to why the previous loaner did not generate as exceptional of results as this unit. I hope Benchmark works with the owner of the other unit and investigates.
 

DonH56

Master Contributor
Technical Expert
Forum Donor
Joined
Mar 15, 2016
Messages
7,891
Likes
16,696
Location
Monument, CO
We need a double like; one for Amir, and one for Benchmark for really stepping up! Very much appreciate both Amir's and Benchmark's efforts!!!
 

rebbiputzmaker

Major Contributor
Joined
Jan 28, 2018
Messages
1,099
Likes
463
I hope Benchmark works with the owner of the other unit and investigates.
Isn't the DAC you received meant to replace Mike's DAC, that is what it sounded like when John proposed it. When Mike sends it back they will check it to see what went wrong.
 

derp1n

Senior Member
Joined
May 28, 2018
Messages
479
Likes
629
It's a bit hard to read the ASIO4ALL vs Benchmark ASIO driver graph - if the spurs were gone with the Benchmark driver, you wouldn't be able to see that due to the presence of the ASIO4ALL spurs and the fact it seems to be drawn on top of the Benchmark driver results?
 
OP
amirm

amirm

Founder/Admin
Staff Member
CFO (Chief Fun Officer)
Joined
Feb 13, 2016
Messages
44,654
Likes
240,798
Location
Seattle Area
It's a bit hard to read the ASIO4ALL vs Benchmark ASIO driver graph - if the spurs were gone with the Benchmark driver, you wouldn't be able to see that due to the presence of the ASIO4ALL spurs and the fact it seems to be drawn on top of the Benchmark driver results?
They are completely on top of each other. Here is the same graph with reverse priority:

1532495575289.png
 
OP
amirm

amirm

Founder/Admin
Staff Member
CFO (Chief Fun Officer)
Joined
Feb 13, 2016
Messages
44,654
Likes
240,798
Location
Seattle Area
Isn't the DAC you received meant to replace Mike's DAC, that is what it sounded like when John proposed it.
No. This is on a 30-day loan to me and will go back to Benchmark.
 

HifiGuy

Member
Joined
Jun 25, 2018
Messages
20
Likes
4
One thing that would recommend that you use the HT Bypass mode. That calibrate the volume to a normalize value. To use the pot to go to the loudest value seems wrong to me.

Greetings Fu
 
Last edited:

Krunok

Major Contributor
Joined
Mar 25, 2018
Messages
4,600
Likes
3,067
Location
Zg, Cro
One thing that would recommend that you use the HT Bypass mode. That calibrate the volume to a normalize value. To use the pot to go to the loudest value seems wrong to me.

Greetings Fu

I don't agree with this - when the pot is cranked to the max that is exactly the point to measure how the device works.
 

Krunok

Major Contributor
Joined
Mar 25, 2018
Messages
4,600
Likes
3,067
Location
Zg, Cro
OK, the DAC3 HGC that Benchmark was kind enough to send arrived today. So I put it on the bench and ran a few tests. I will be on the road tomorrow late morning so if you want to have anything else measured (hopefully not!), ask right away.

NOTE: all measurements are using balanced output unless noted, with -10 dB jumper applied as the original review.

Let's start with our Dashboard view:
View attachment 14207


For completeness, let's run through the rest of our tests:

View attachment 14211

Trully exceptional device!

@amirm - On the lower graph THD+N at 1kHz is not exactly 0,0002% as measured at 1kHz on the upper graph. How so?

It would really be nice to see performance with unballanced output as well. :)
 
Last edited:

raband

Member
Joined
Jul 1, 2018
Messages
22
Likes
30
Wow - well done to all.

Sensible discussion and conversations can result in sensible results.

Totally a win/win here.

Definitely a lesson in the correct way for a company to back up their product, knowledge and experience when faced with valid questions.

Looking forward to the results/conclusions Benchmark come to when they get to look at the original unit.
 

derp1n

Senior Member
Joined
May 28, 2018
Messages
479
Likes
629
It's curious that Jude's jitter results still look better - absolutely no sidebands:
10142000.jpg

Test tone level is a fair bit lower and noise floor is a bit lower too, so maybe not identical test parameters?
 
Last edited:

Dro

Active Member
Joined
Apr 8, 2018
Messages
221
Likes
207
The THD+N vs frequency graph does not seem to match SINAD. Isn't 0.0005% -106 dB? That would not match a SINAD of 112 dB, would it?
 

March Audio

Master Contributor
Audio Company
Joined
Mar 1, 2016
Messages
6,378
Likes
9,321
Location
Albany Western Australia
It's curious that Jude's jitter results still look better - absolutely no sidebands:
10142000.jpg

Test tone level is a fair bit lower and noise floor is a bit lower too, so maybe not identical test parameters?


You are correct, the test parameters are not even close. Judes graph above is about 0dbV. dBV is referenced to 1 V rms, i.e 0dBV is 1 V rms. Amir has tested at a much higher level of about +20dBV which is about 10 V rms.

Useful calculator here:
http://www.sengpielaudio.com/calculator-db.htm
 
OP
amirm

amirm

Founder/Admin
Staff Member
CFO (Chief Fun Officer)
Joined
Feb 13, 2016
Messages
44,654
Likes
240,798
Location
Seattle Area
The THD+N vs frequency graph does not seem to match SINAD. Isn't 0.0005% -106 dB? That would not match a SINAD of 112 dB, would it?
You guys are really getting good at scrutinizing these graphs. :)

Fortunately there is a good explanation for this one. The graphs in the dashboard have a 22 Khz bandwidth for distortion and noise. The THD+N however, has a 90 kHz bandwidth so that it can show the distortions and harmonics of 20 kHz signal. I used to use a lower bandwidth but it would show a drop at 20 kHz. Hard to decide which one is better.

Anyway, with a 90 kHz bandwidth, more noise and distortion is included in the THD+N vs frequency and hence lower performance.
 
Top Bottom